
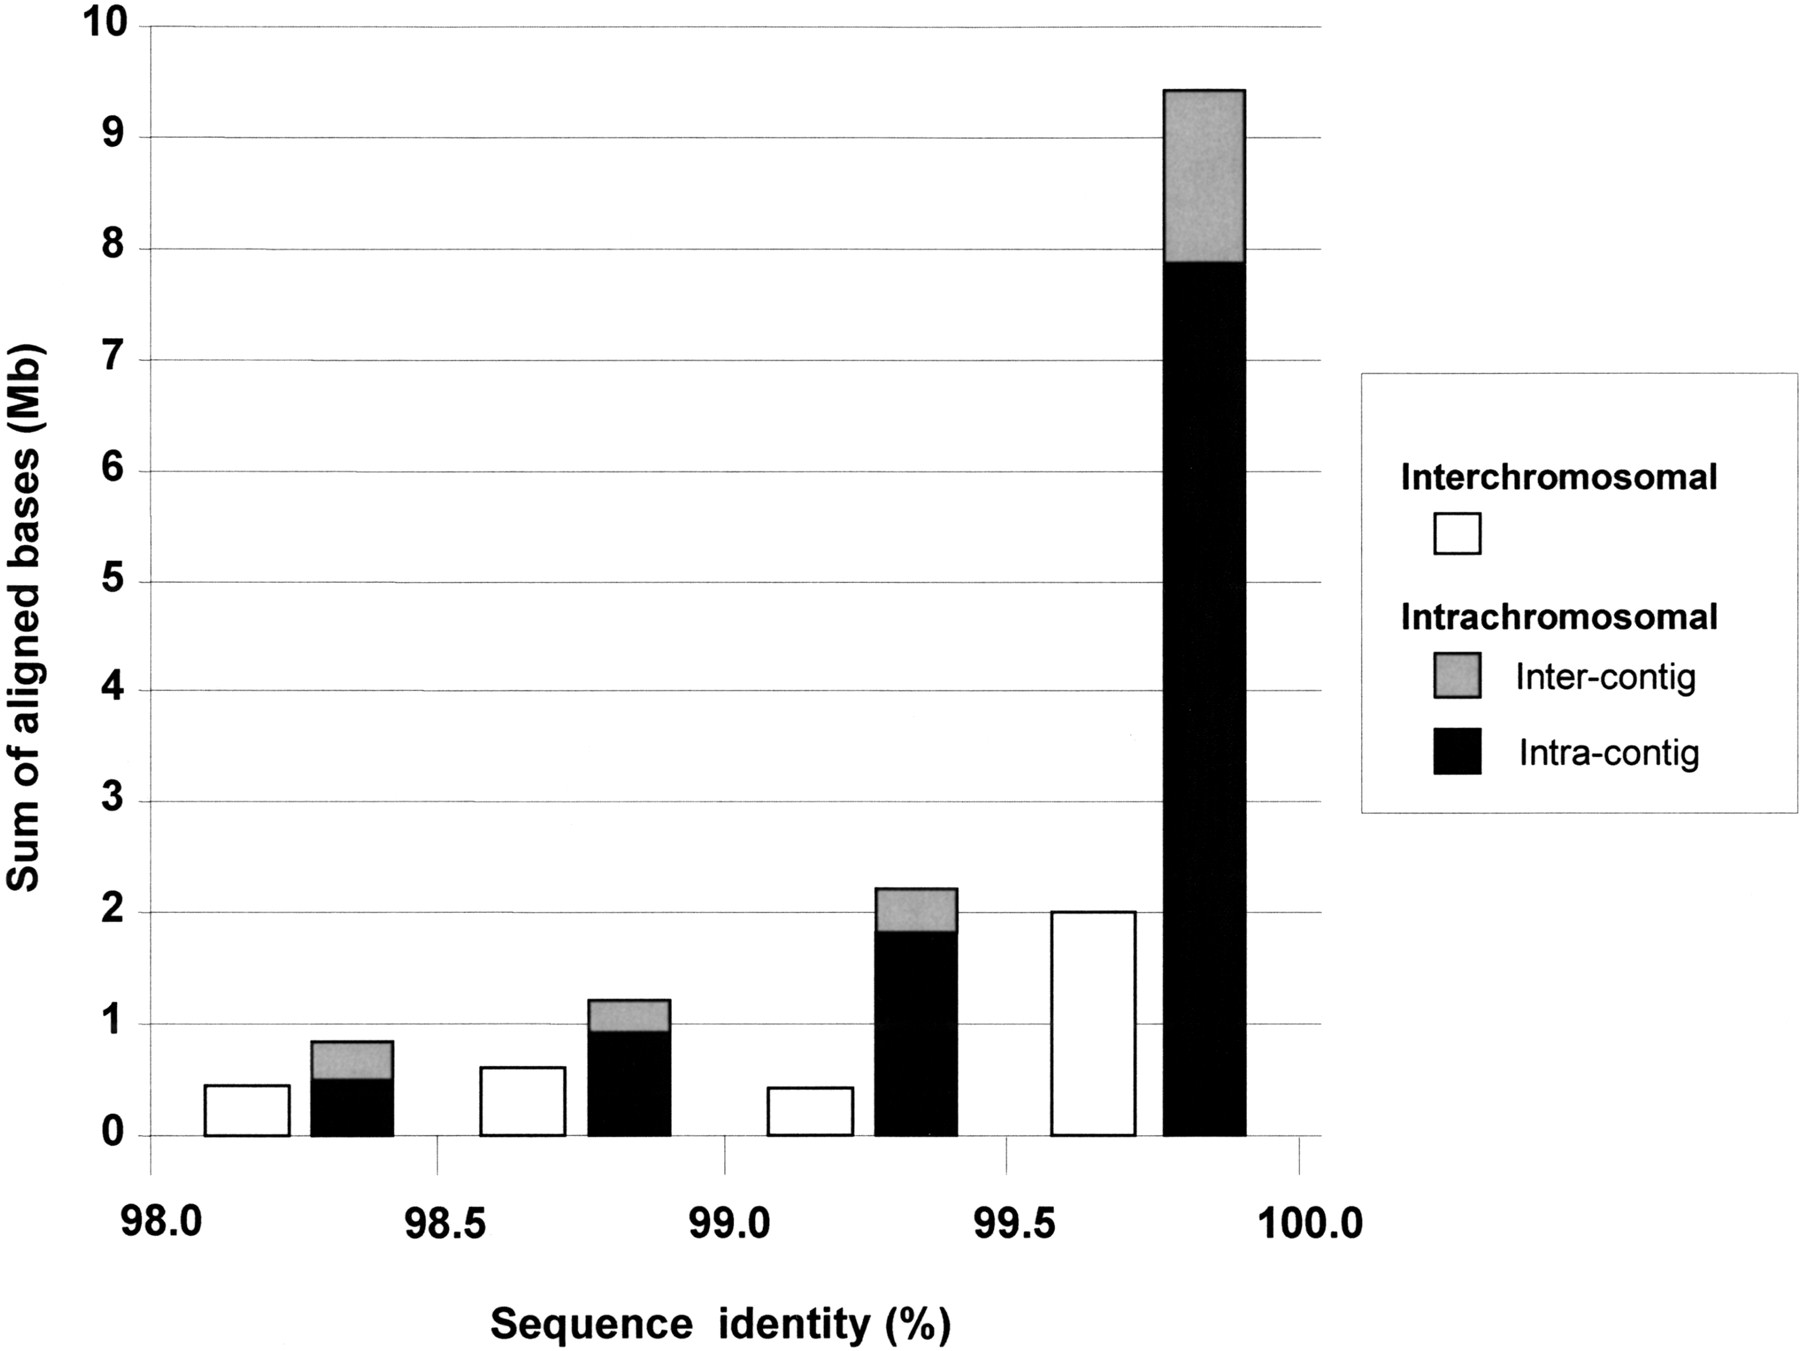
Figure 4.
Distribution of highly homologous duplications (>98% identity). A histogram showing the sum of aligned bases for different bins of percent identity. Colors denote interchromosomal alignments (red) and intrachromosomal alignments, which may further subdivided into intercontig (light blue) or intracontig (dark blue) “duplications.”


