
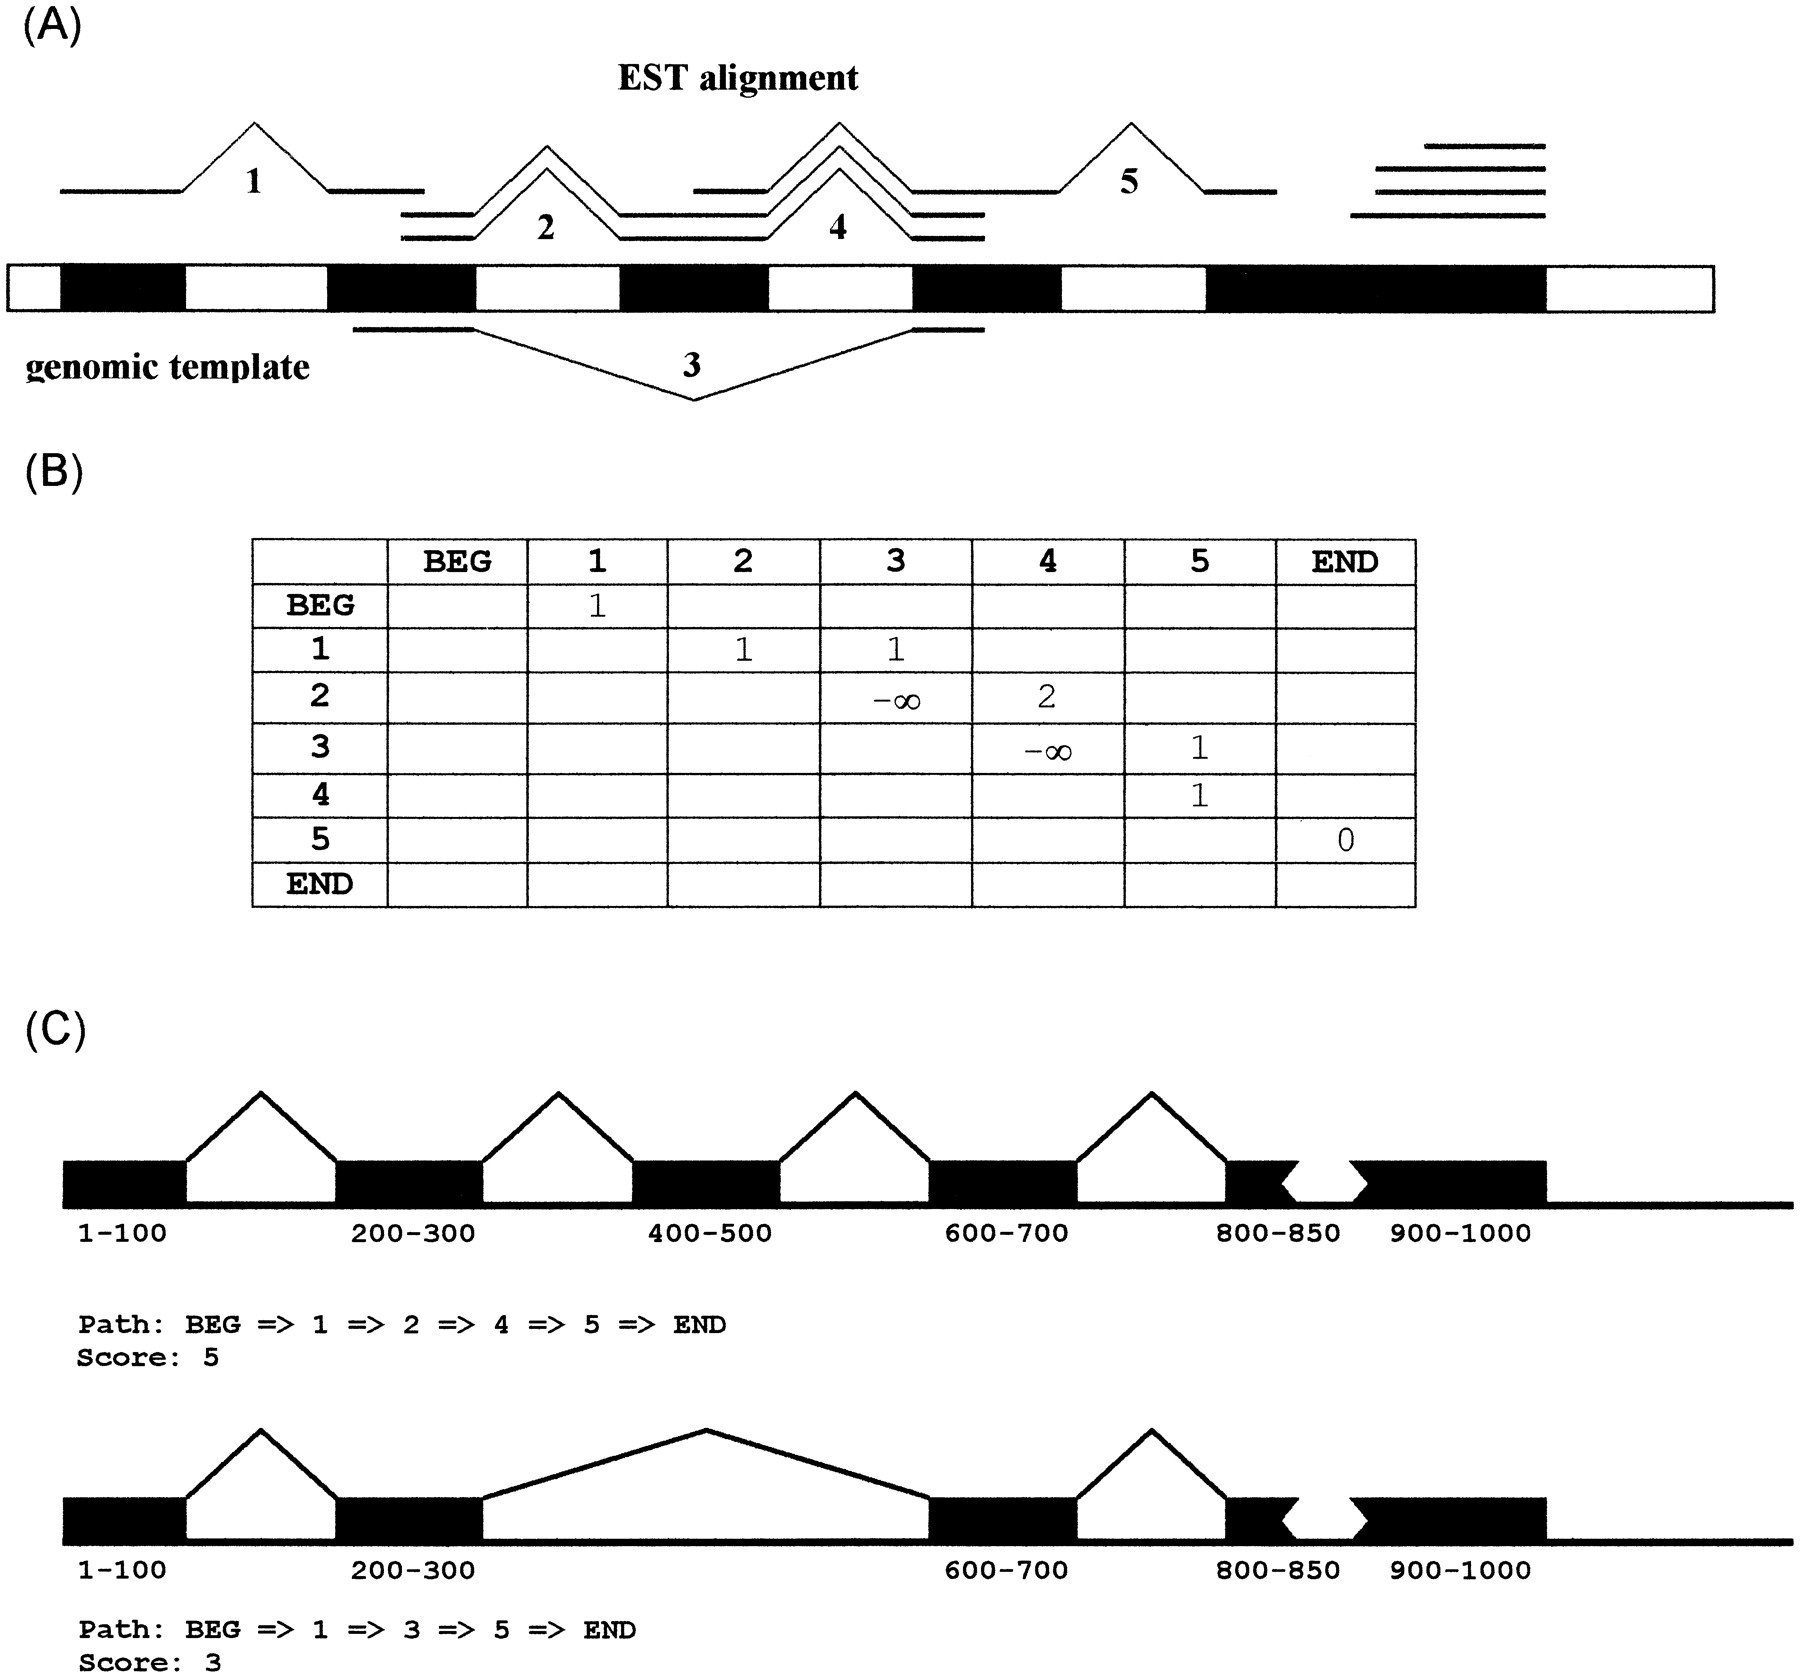
Gene structure assembly. (A) Shown here is a hypothetical gene structure (block) and genomic EST alignments (line). There are five inferred splice pairs. Splice pairs 1 and 2 are transitively connected. Splice pairs 2 and 4 are contiguously connected. Both splice pairs 2 and 4 are mutually exclusive with splice pair 3. There is a coverage gap between splice pair 5 and the 3′ end. (B) The connectivity matrix for assembling this gene structure. The nodes include the 5′ beginning (BEG) of the EST alignments, the 3′ end (END) and five predicted splice pairs. The numerical value in cell M(i,j) is determined from the EST-encoded connectivity between the ithand jth nodes. For instance, two EST alignments link splice pairs 2 and 4, so M(2,4) = 2. (C) Two alternative gene structures inferred from two different traces through the matrix. The higher scoring trace gives rise to the predominant gene structure.


