
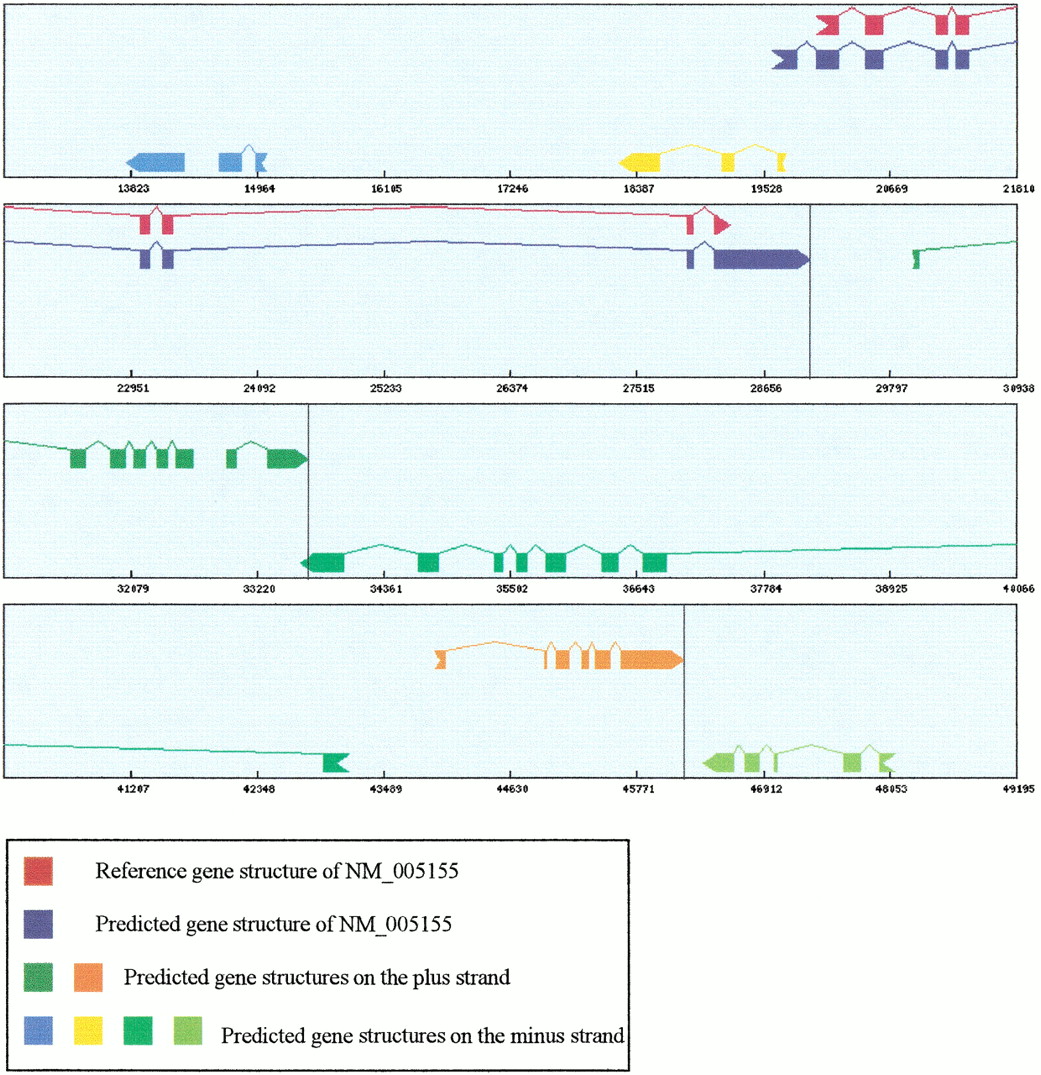
Gene prediction on both strands. This is a graphic illustration of gene predictions in the genomic template of NM_005155, palmitoyl-protein thioesterase 2 (PPT2). Reference gene structure is shown in the first level of each window. Gene predictions on the plus strand are plotted in the second level and gene predictions on the minus strand are plotted in the bottom level. The transcriptional direction of a gene is also indicated by the arrow shape of its terminal exon. Only poly-A sites on the plus strand are shown in vertical lines. The middle levels are used to display alternative splicing patterns that are inferred by comparing predicted splice junction pairs with the reference gene structure. Note that the predicted gene structure of NM_005155 consists of extensions to the reference gene structure at both ends. The second predicted gene on the plus strand overlaps with the 3′ UTR of a gene on the opposite strand, but its 3′ boundary is not extended.


