
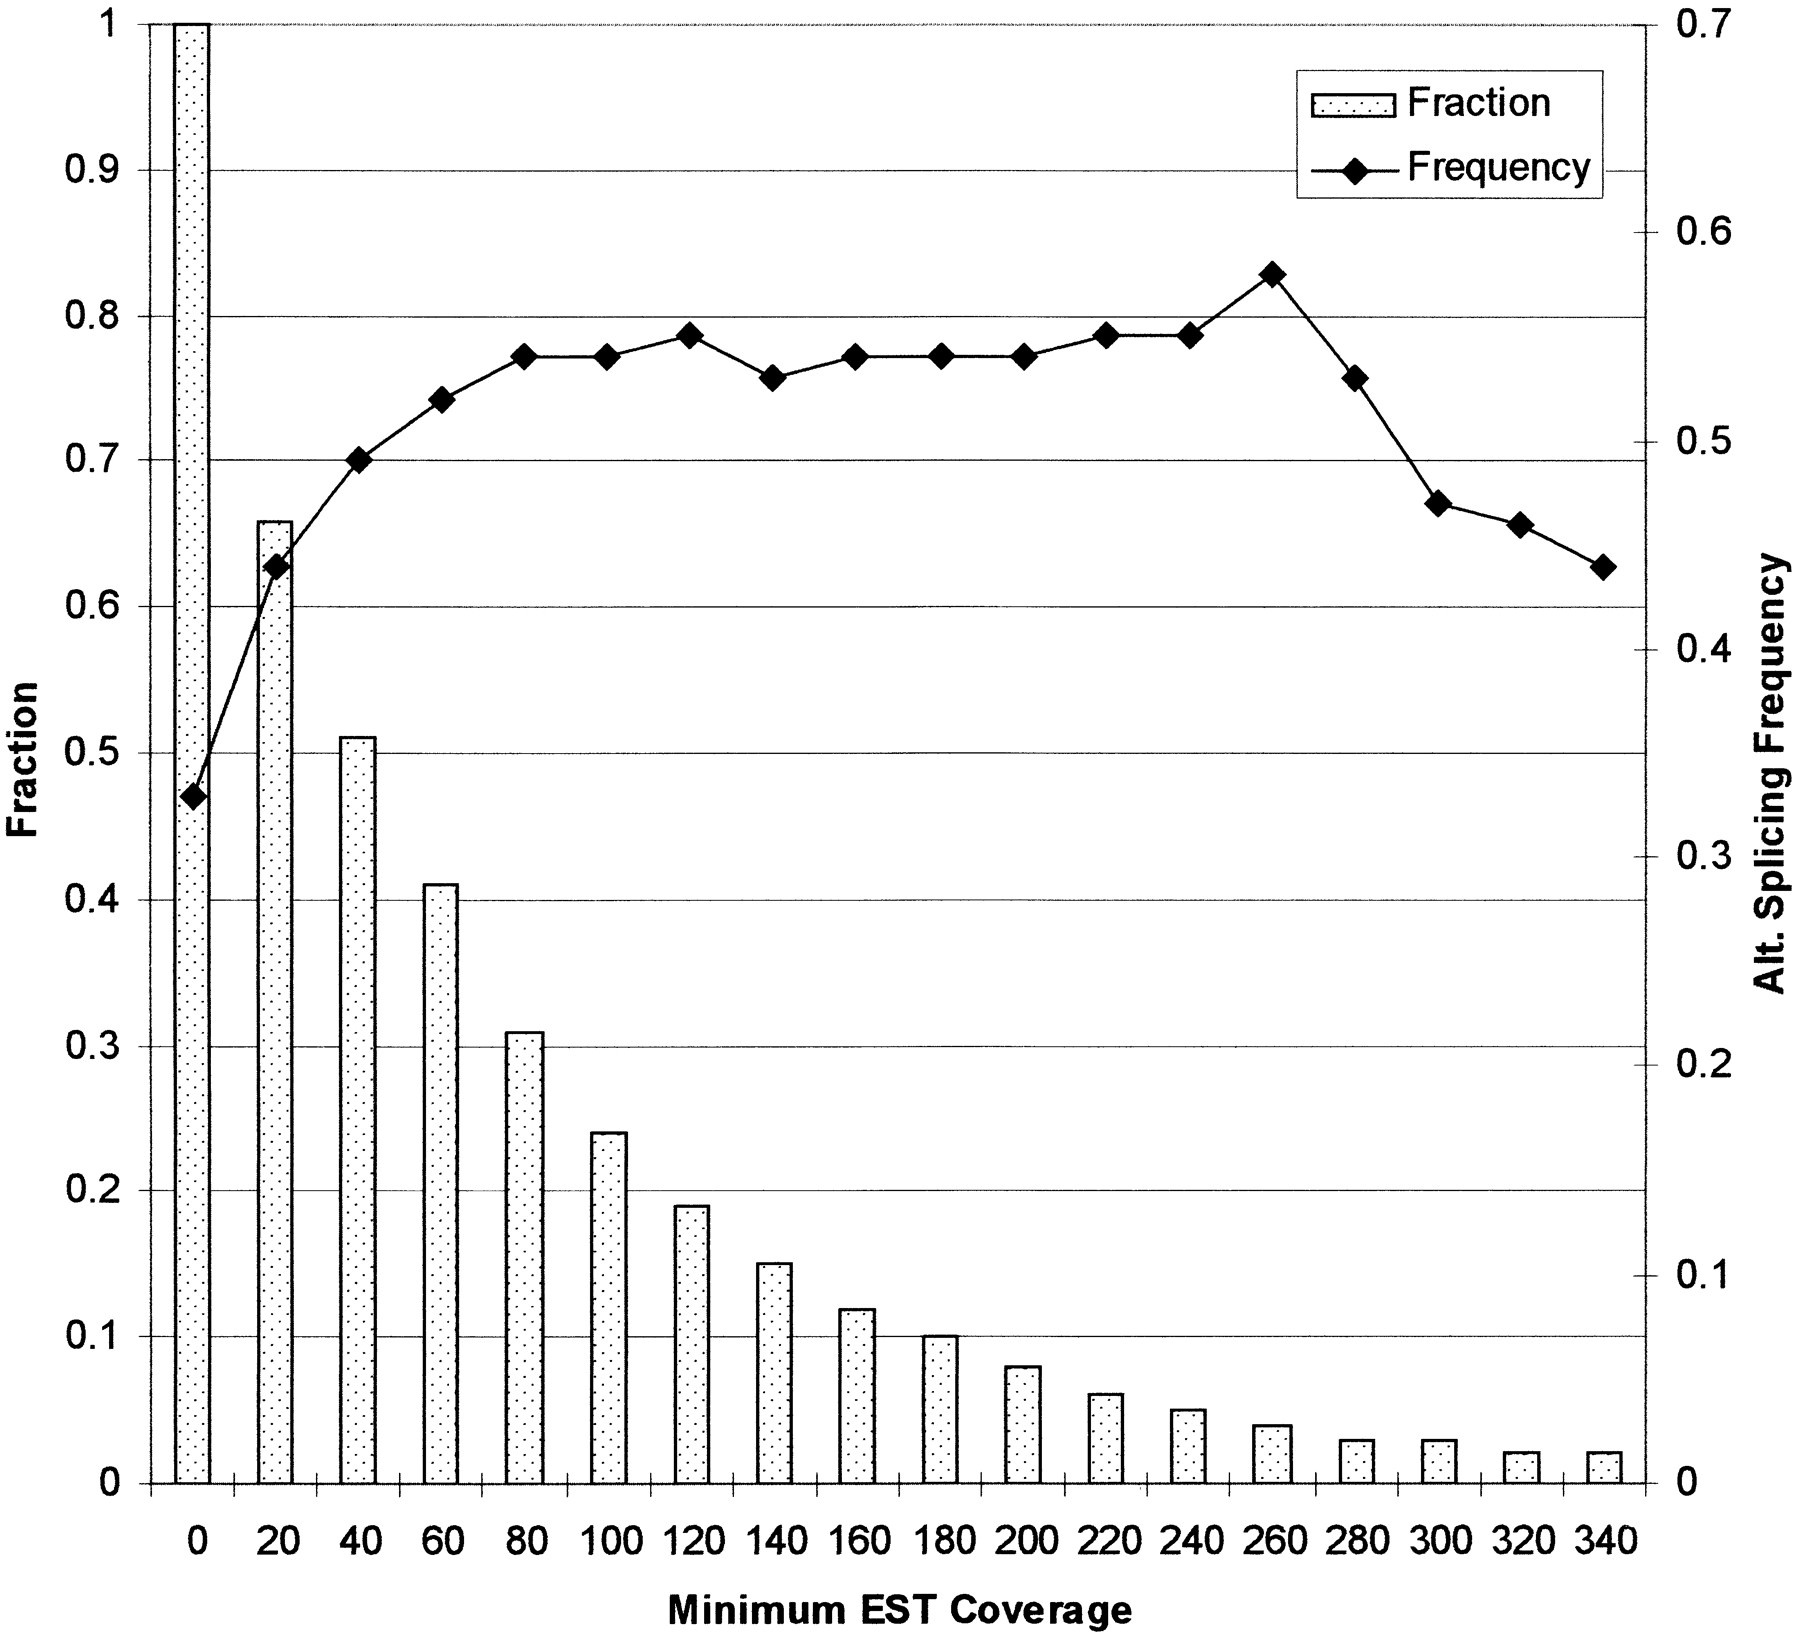
Figure 4.
Correlation of alternative splicing frequency with EST coverage. The frequency of alternative splicing was measured by the proportion of sequences that were alternatively spliced. A threshold on minimum EST coverage was imposed to select a subset of sequences. As the threshold was raised from zero to 340, the fraction of sequences (bar,left axis) that met the requirement was decreasing. The alternative splicing frequency (line, right axis) increased from 33% to 55% at lower EST coverage, and stabilized at roughly 55% at higher EST coverage.


