
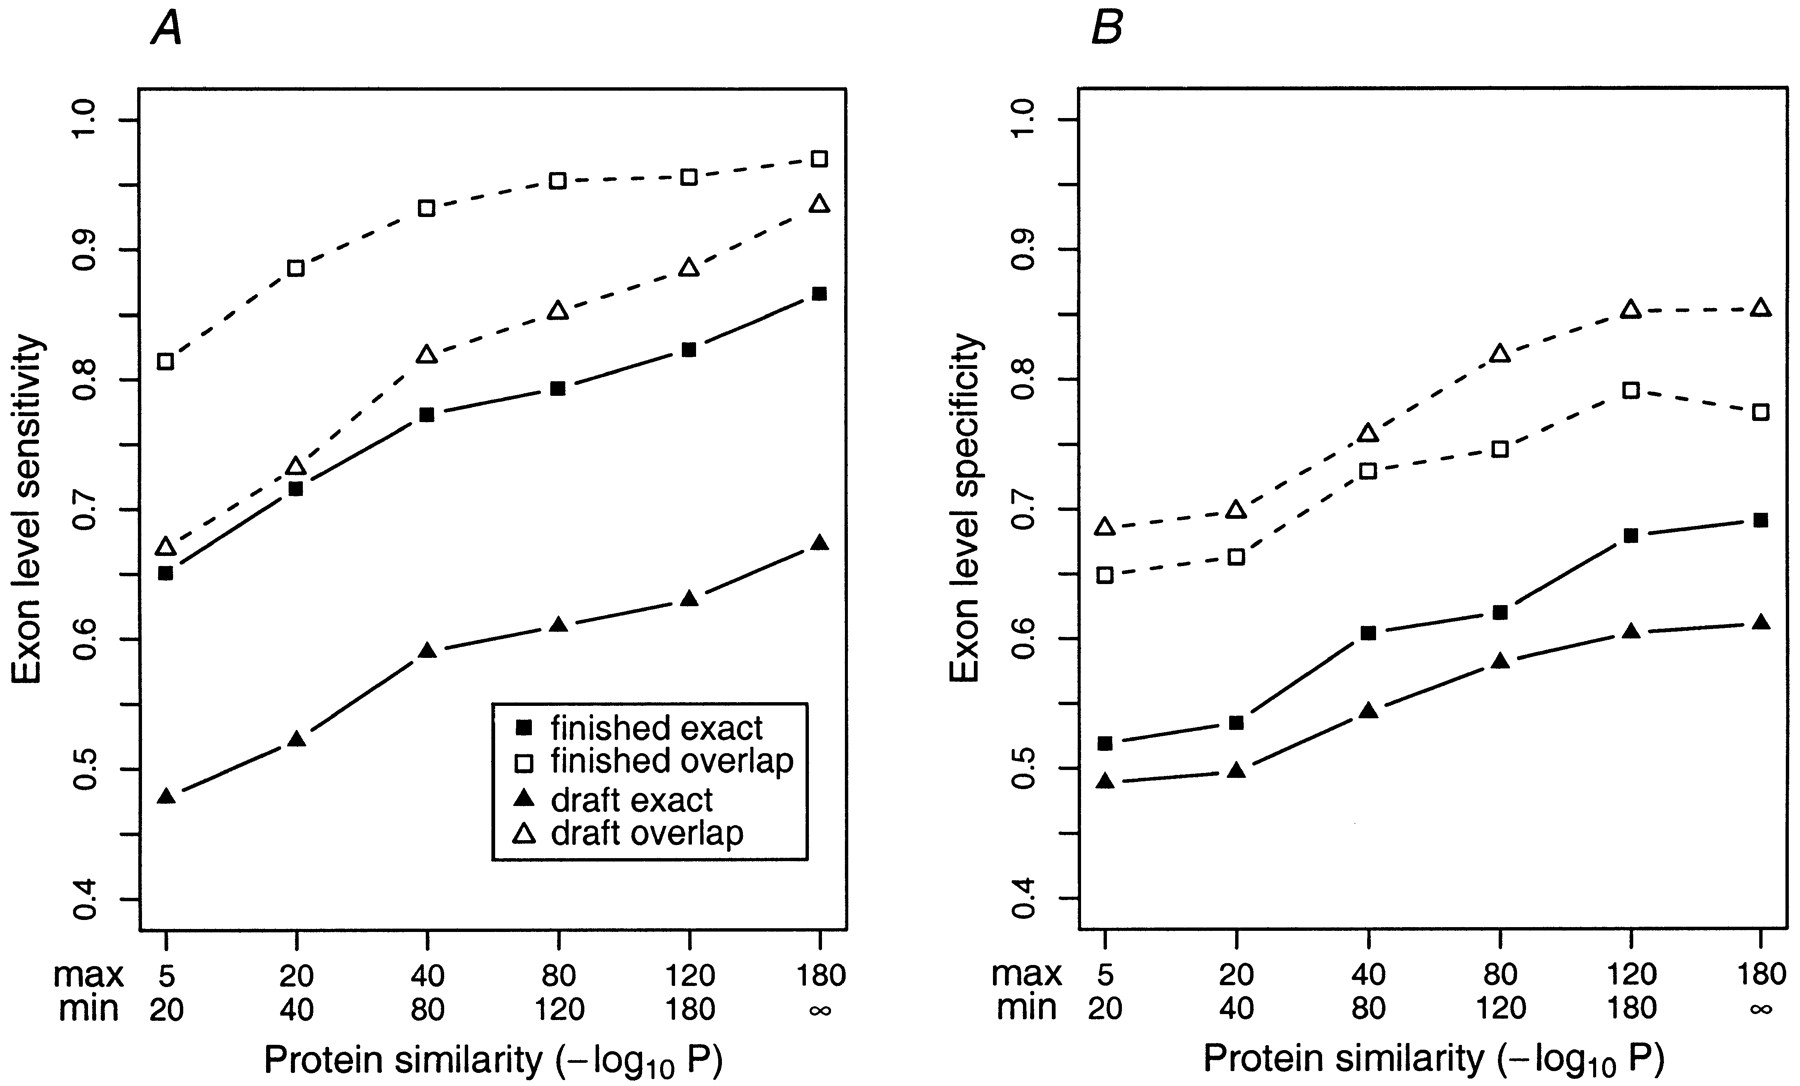
Exon-level accuracy of GenomeScan as a function of protein similarity in draft and finished sequences. GenomeScan was run on subsets of the FinishGene and DraftGene datasets, grouped according to the level of similarity to the nearest proteins used in the predictions. (A) Exon-level sensitivity (percent of annotated exons predicted exactly) is displayed with solid squares/triangles and solid lines; overlap sensitivity (percent of annotated exons overlapped by a predicted exon) by open squares/triangles and dashed lines. (B) Exon-level specificity (percent of predicted exons exactly correct) is displayed with solid squares/triangles and solid lines. Overlap specificity (percent of predicted exons overlapped by an annotated exon) is displayed by open squares/triangles and broken lines. For comparison, overlap exon-level sensitivity and specificity values forGENSCAN + BLASTP (GENSCANpredictions that have a BLASTP hit with P < 10−5 against the nonredundant protein database) were 0.90 and 0.48, respectively, in the FinishGene dataset and 0.87 and 0.47, respectively, in the DraftGene dataset.


