
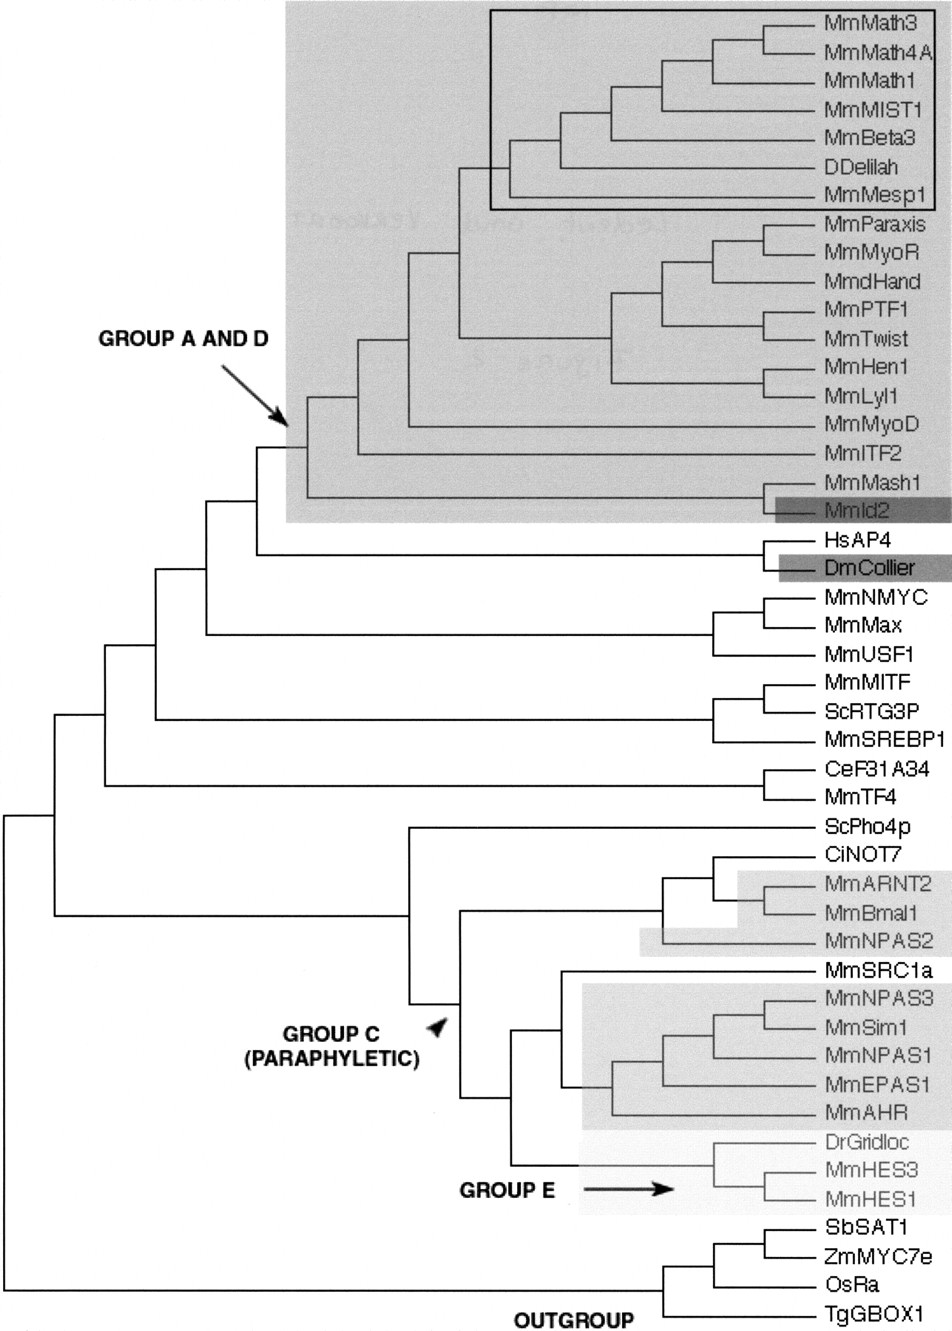
A neighbor-joining (NJ) tree showing the evolutionary relationships of the 44 bHLH families listed in Table 1 as well as the orphan genesdelilah (putative D. melanogaster neuroD gene) andF31A3.4 (as a representative of a group of three C. elegans genes that cluster together with high bootstrap value; see Table 3). We used one gene (usually from mouse) per family to construct this tree. Although there are strong theoretical reasons for preferring the unrooted tree, we show a rooted tree because it is easier to display compactly and more clearly represents the relationships at the tip of the branches. This tree is just a representation of an unrooted tree with rooting that should be considered arbitrary. We used the four plant bHLH families as outgroup. For similar sake of simplicity, we show a tree in which branch lengths are not proportional to distances between sequences. A tree with meaningful branch lengths can be found at http://www.cnrs-gif.fr/cgm/evodevo/bhlh/index.html. The two monophyletic high-order groups A + D (large, dark-gray box and arrows) and E (very light-gray box) are highlighted. The Emc family (the high-order group D of Atchley and Fitch 1997; represented in our tree by Mm Id2) is shown in a black box and the group F (COE family) in a dark gray box. The bHLH-PAS families (the high-order group D ofAtchley and Fitch 1997) are shown in intermediate gray boxes. Their last common ancestor (arrowhead) is also that of non bHLH-PAS families and the group is hence paraphyletic. Finally, all the other families were included in the high-order group B of Atchley and Fitch (1997), a group that appears to be paraphyletic (the common ancestor of these families is that of all bHLH genes). The Atonal superfamily is pointed out (black square) and is detailed in Figure 3. Abbreviations are as listed in Figure 1. The alignment on which this tree is based and complementary phylogenetic analyses are available athttp://www.cnrs-gif.fr/cgm/evodevo/bhlh/index.html.


