
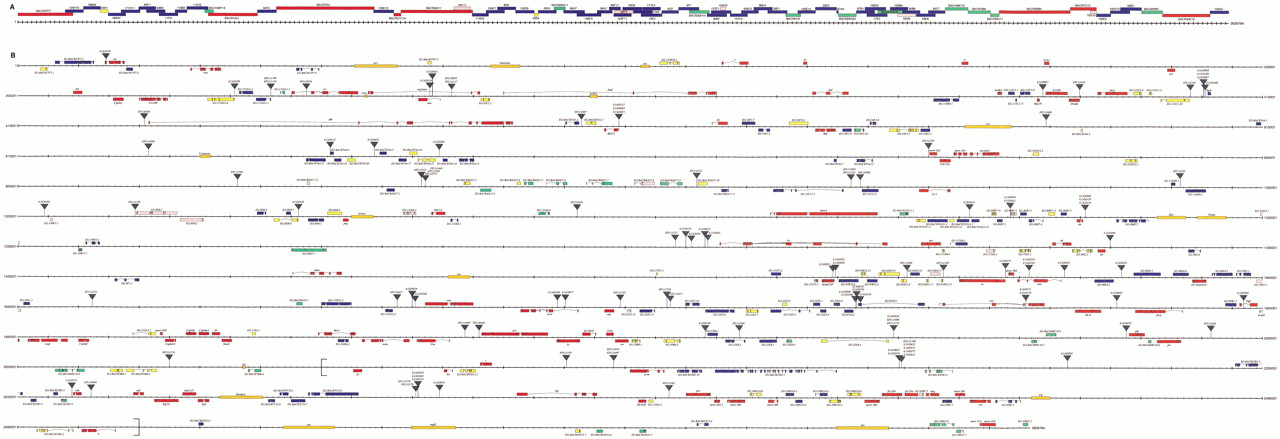
Physical maps of the interval 1A–3C. (A) Minimal tiling pattern of clones sequenced in divisions 1A–3C. BACR clones are indicated in red; BACN and BACH clones are indicated in green; cosmid clones are indicated in blue; redundant clones sequenced are indicated in pink; a few small regions were sequenced from other clones, these are indicated in yellow. The BACR, BACN, and BACH clones are from the same strain as that sequenced by the BDGP and Celera; the cosmids are from a different strain (see Methods). Scale divisions are 10 Kb. (B) Genes, transposable elements, and P-elementinsertions in divisions 1A–3C. Known genes are shown in red; genes with significant protein similarities to nondrosophilid proteins are shown in blue; predicted genes with EST hits are shown in yellow; predicted genes with no EST hits are shown in green; predicted genes with protein motif matches are shown in pink. Transposable elements are shown in orange within the sequence coordinate line. The sites ofP-element and EP-element insertions are indicated by gray triangles. The large square brackets from 2100 to 2480 Kb embrace the zeste-white region (Figure 2). Scale divisions are 10 Kb (bold) and 1 Kb (regular).


