
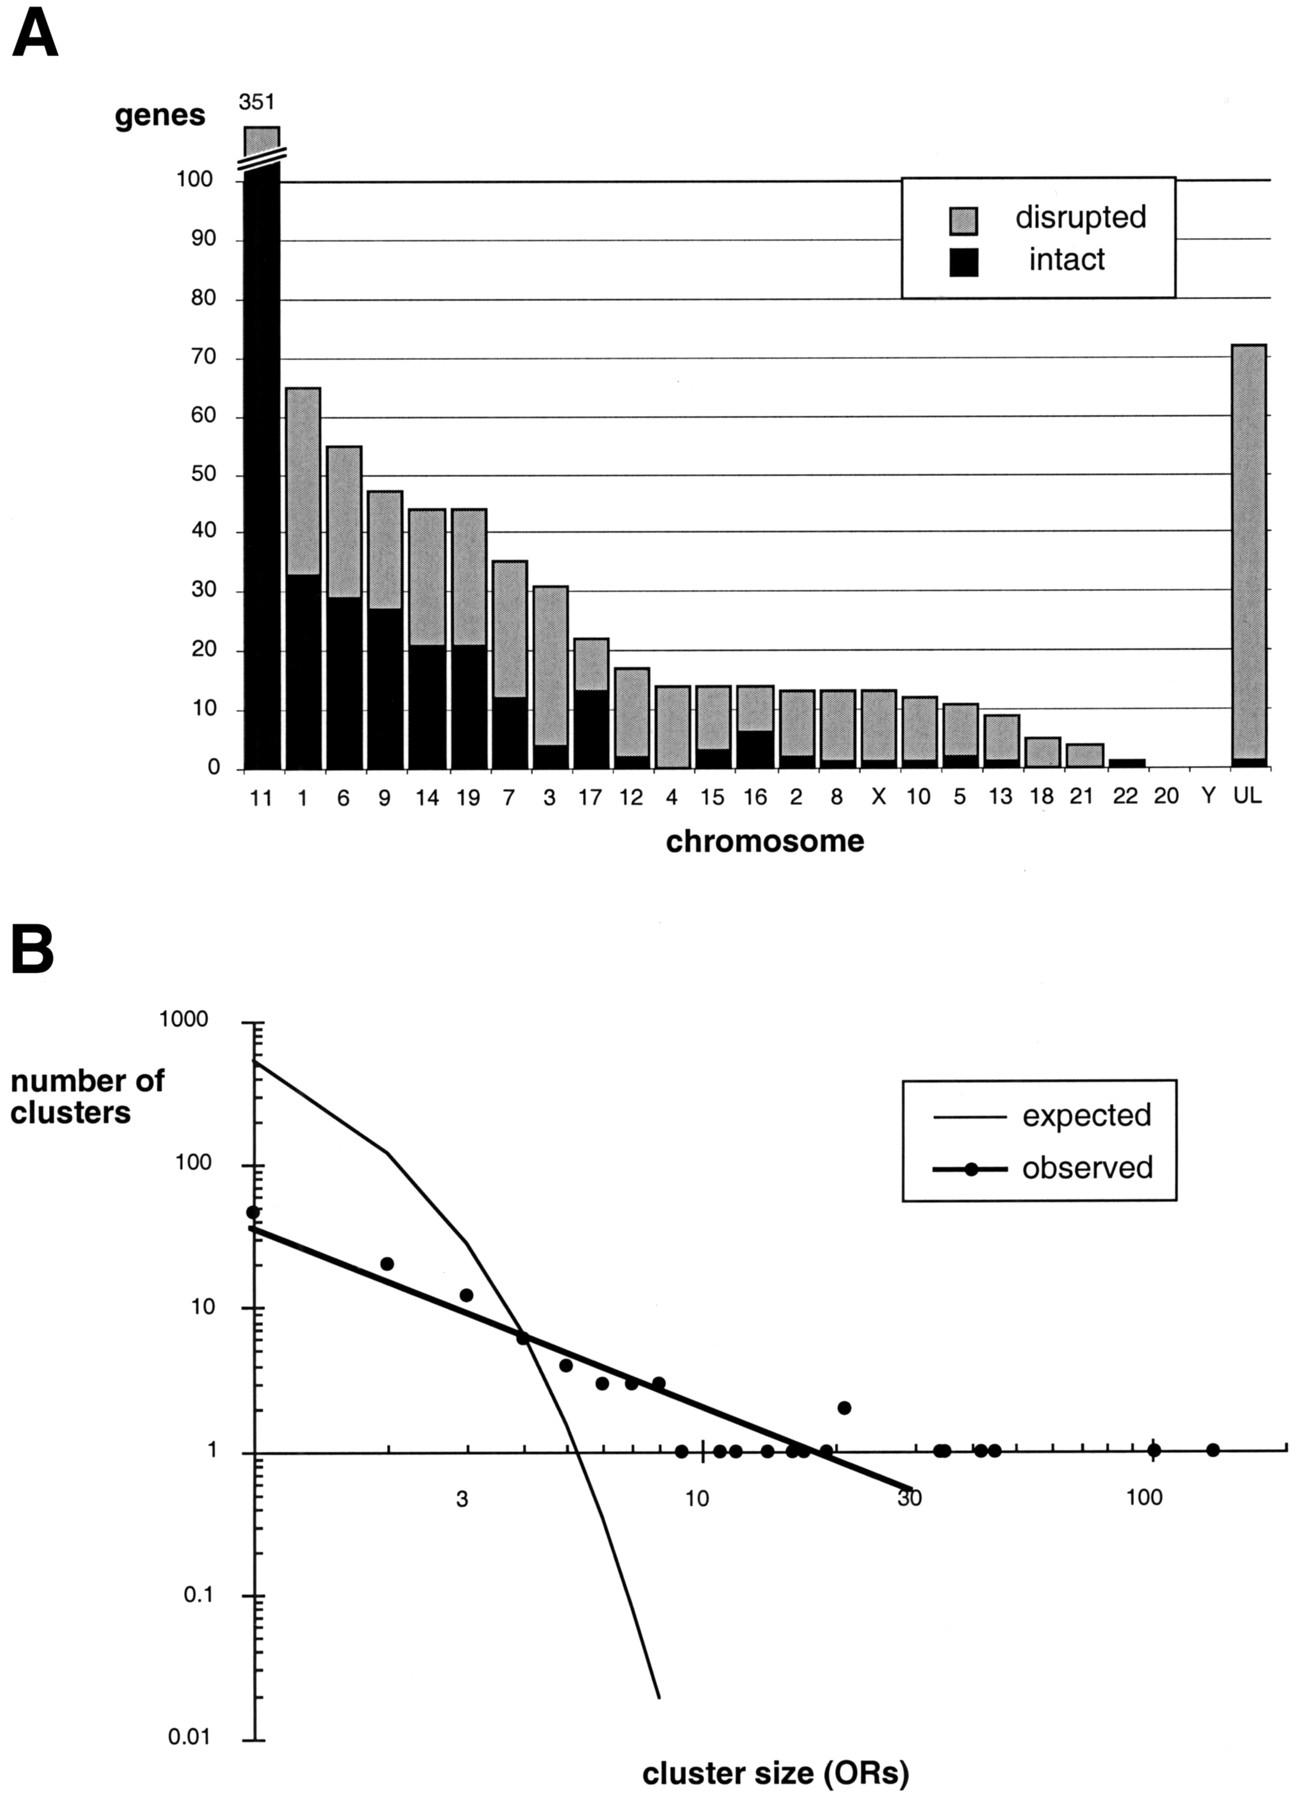
Figure 3.
Distribution of ORs in chromosomes and clusters. (A) Number of ORs per chromosome (UL-unlocalized) sorted by decreasing OR numbers. (B) Distribution of cluster sizes. The thin line indicates the exponentially decaying expected cluster size, assuming a random chromosomal disposition. An expectation value of less than one is obtained for clusters of six ORs or more. The thick line indicates a power-law fit to the observed cluster distribution.


