
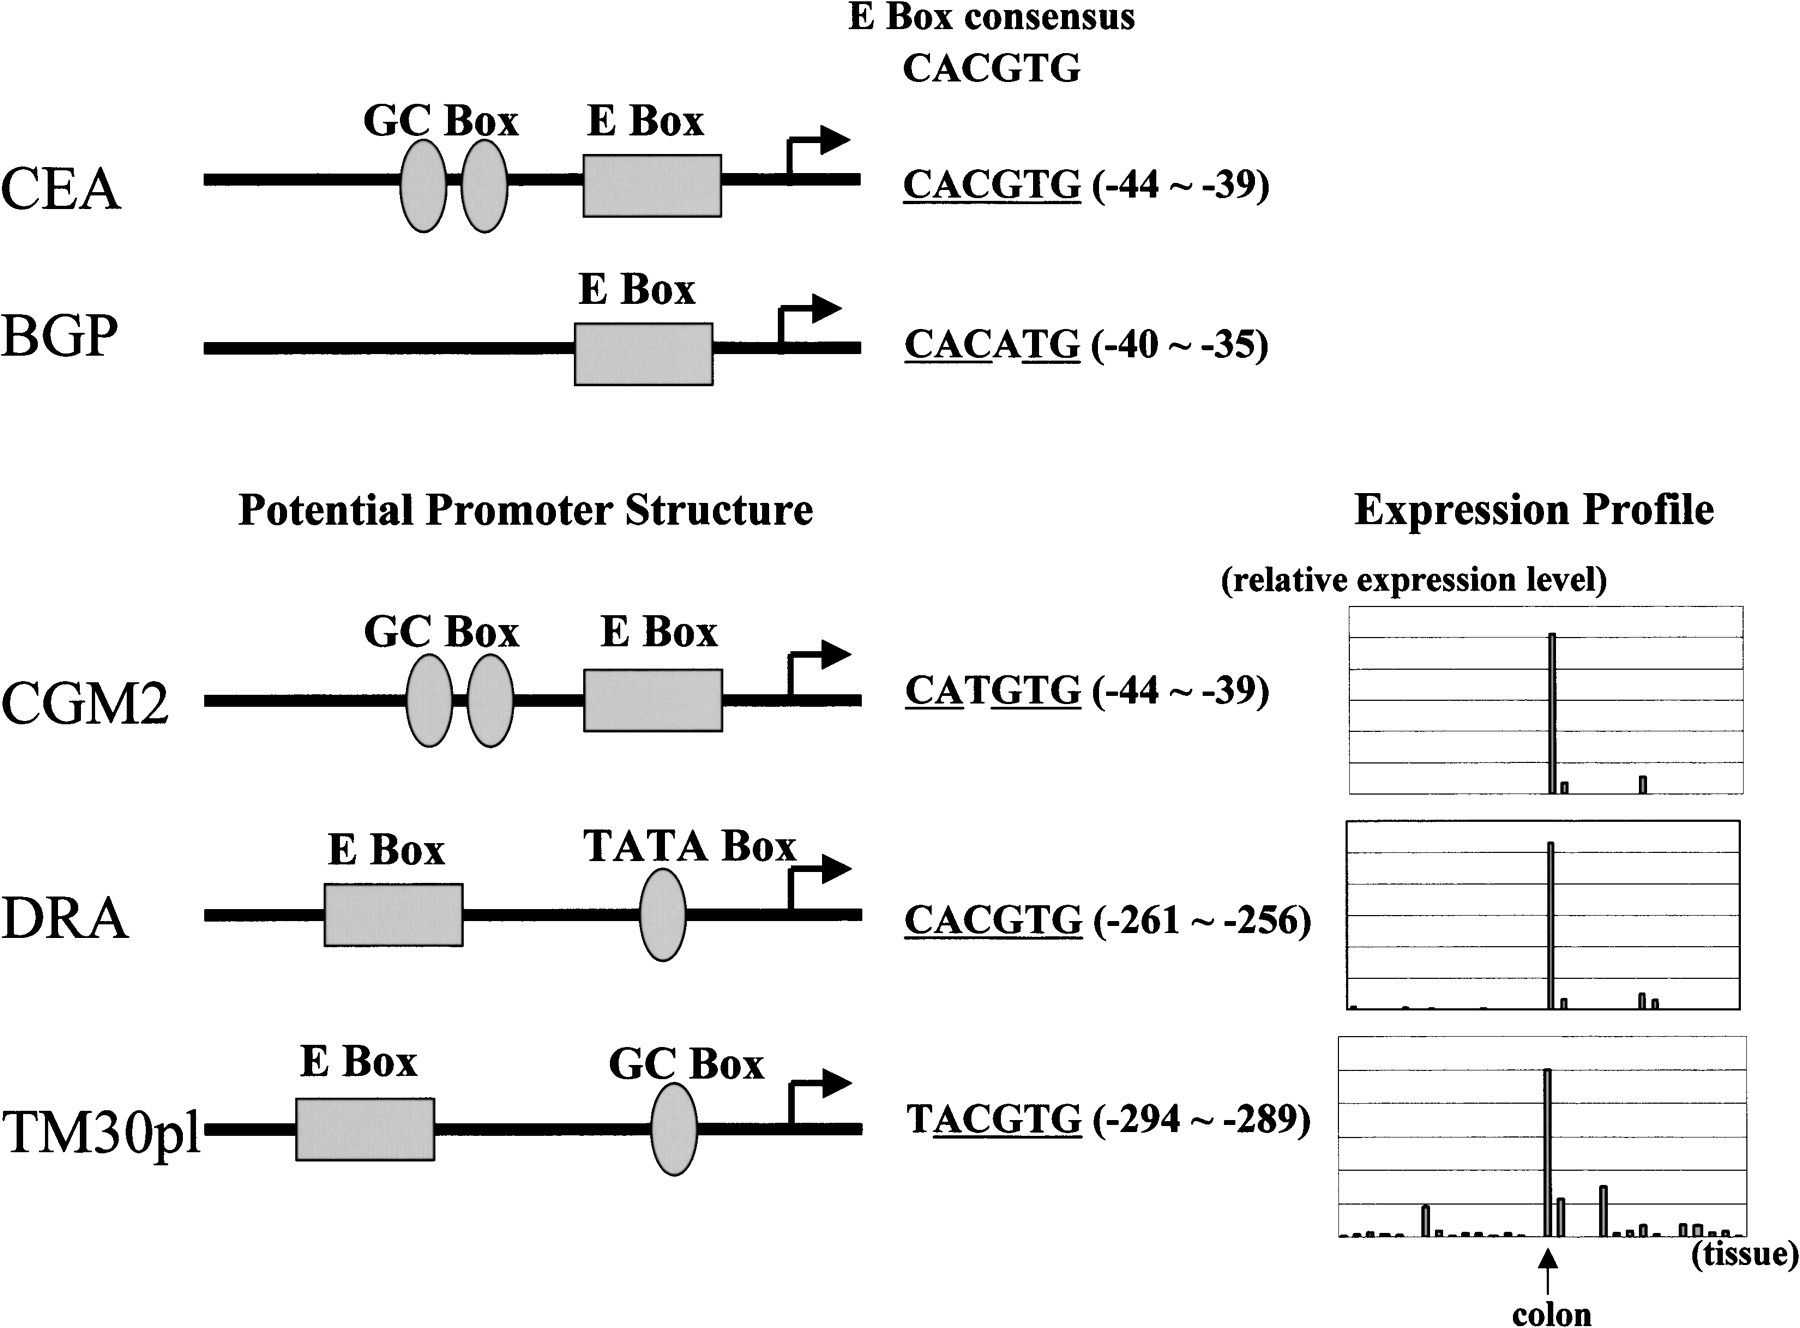
Figure 5.
Potential promoter structures and expression profiles of theCGM2 gene, the DRA gene, and theTM30pl gene are shown. The promoter structures were predicted from corresponding potential promoter region (PPR) sequences using TFBIND. Previously reported promoter structures of the CEA gene and the BGP gene are shown attop. Consensus sequence of E box and the sequences of predicted E boxes are shown to the right of the promoter structures. The nucleotides that match the consensus sequence are underlined. Each position of the predicted E box is also shown. The expression profile observed by iAFLP is shown at right for each gene (for more details, see http://bodymap.ims.u-tokyo.ac.jp).


