
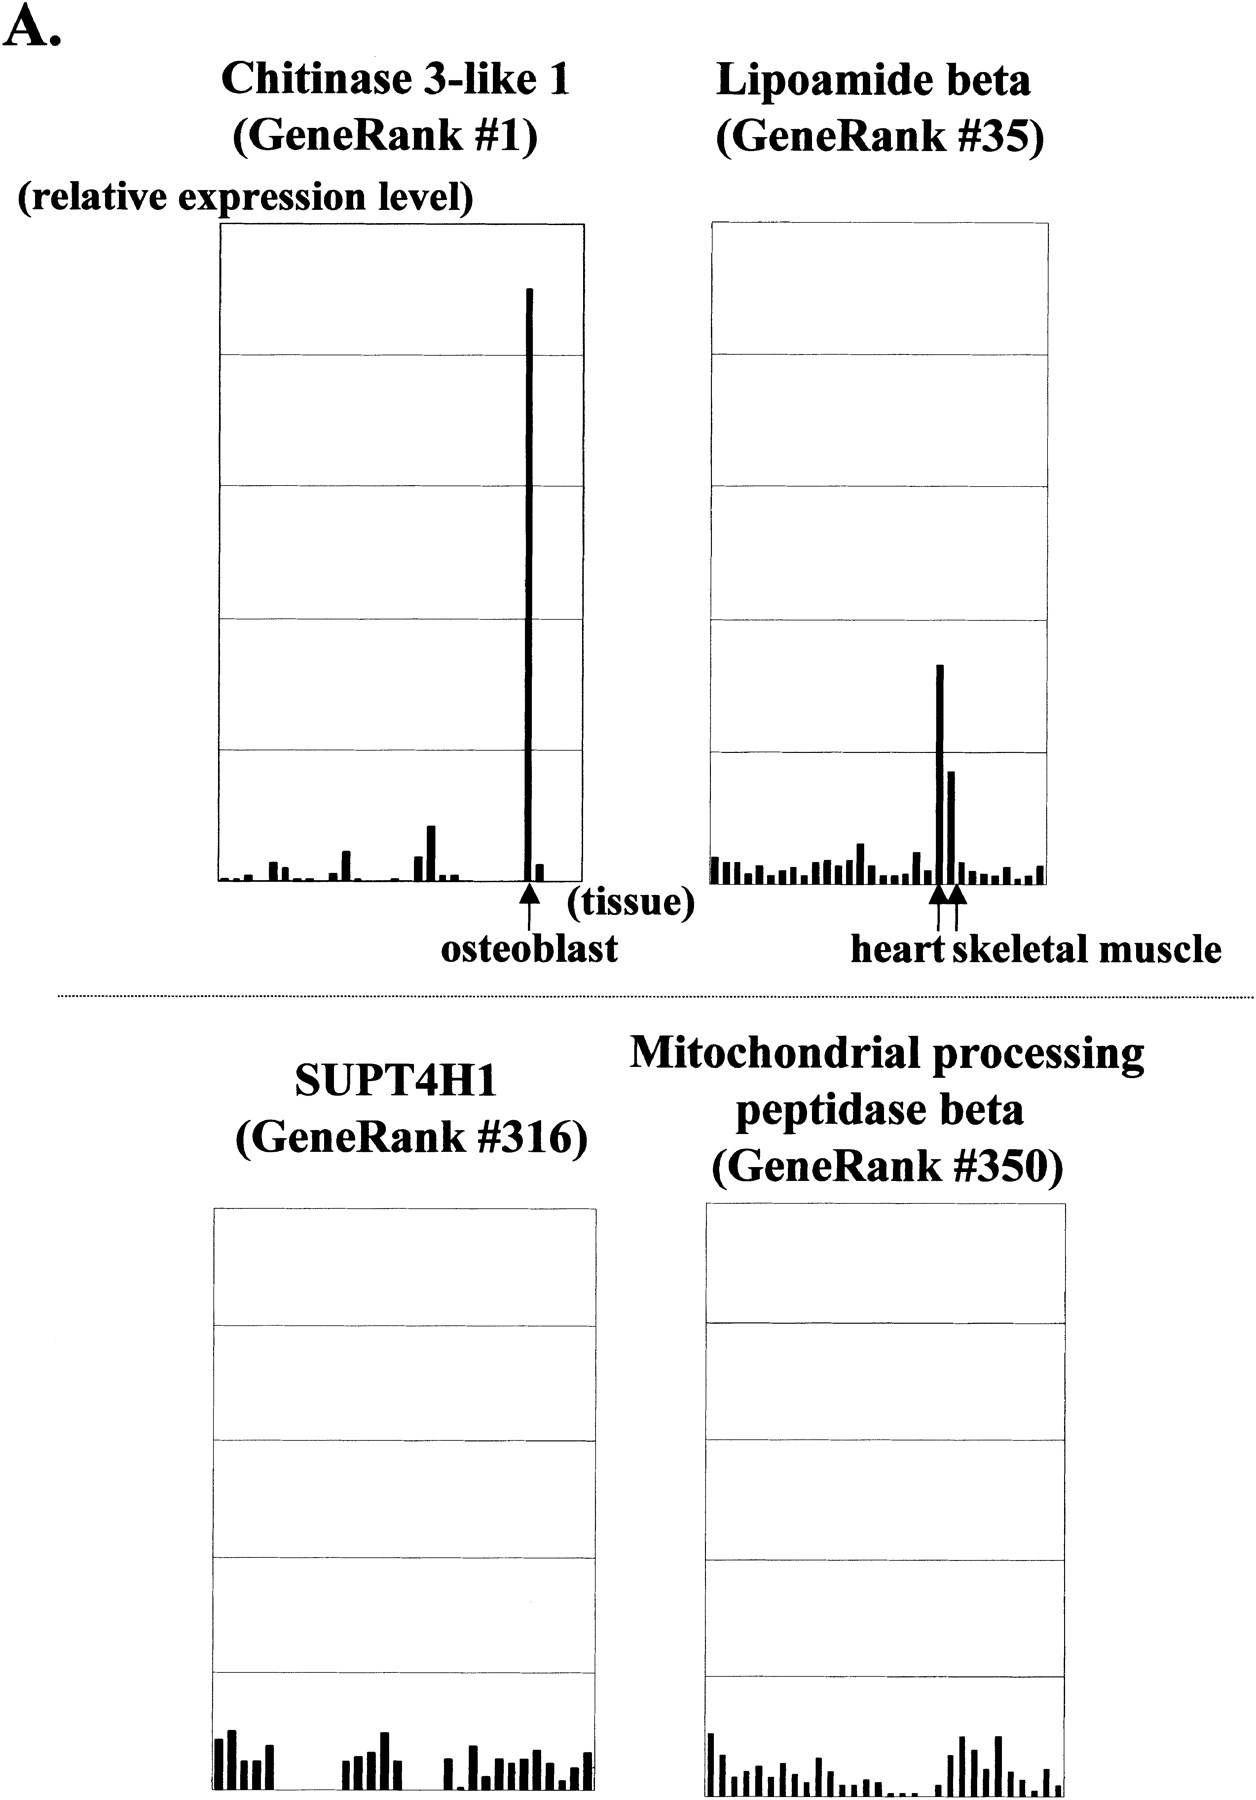
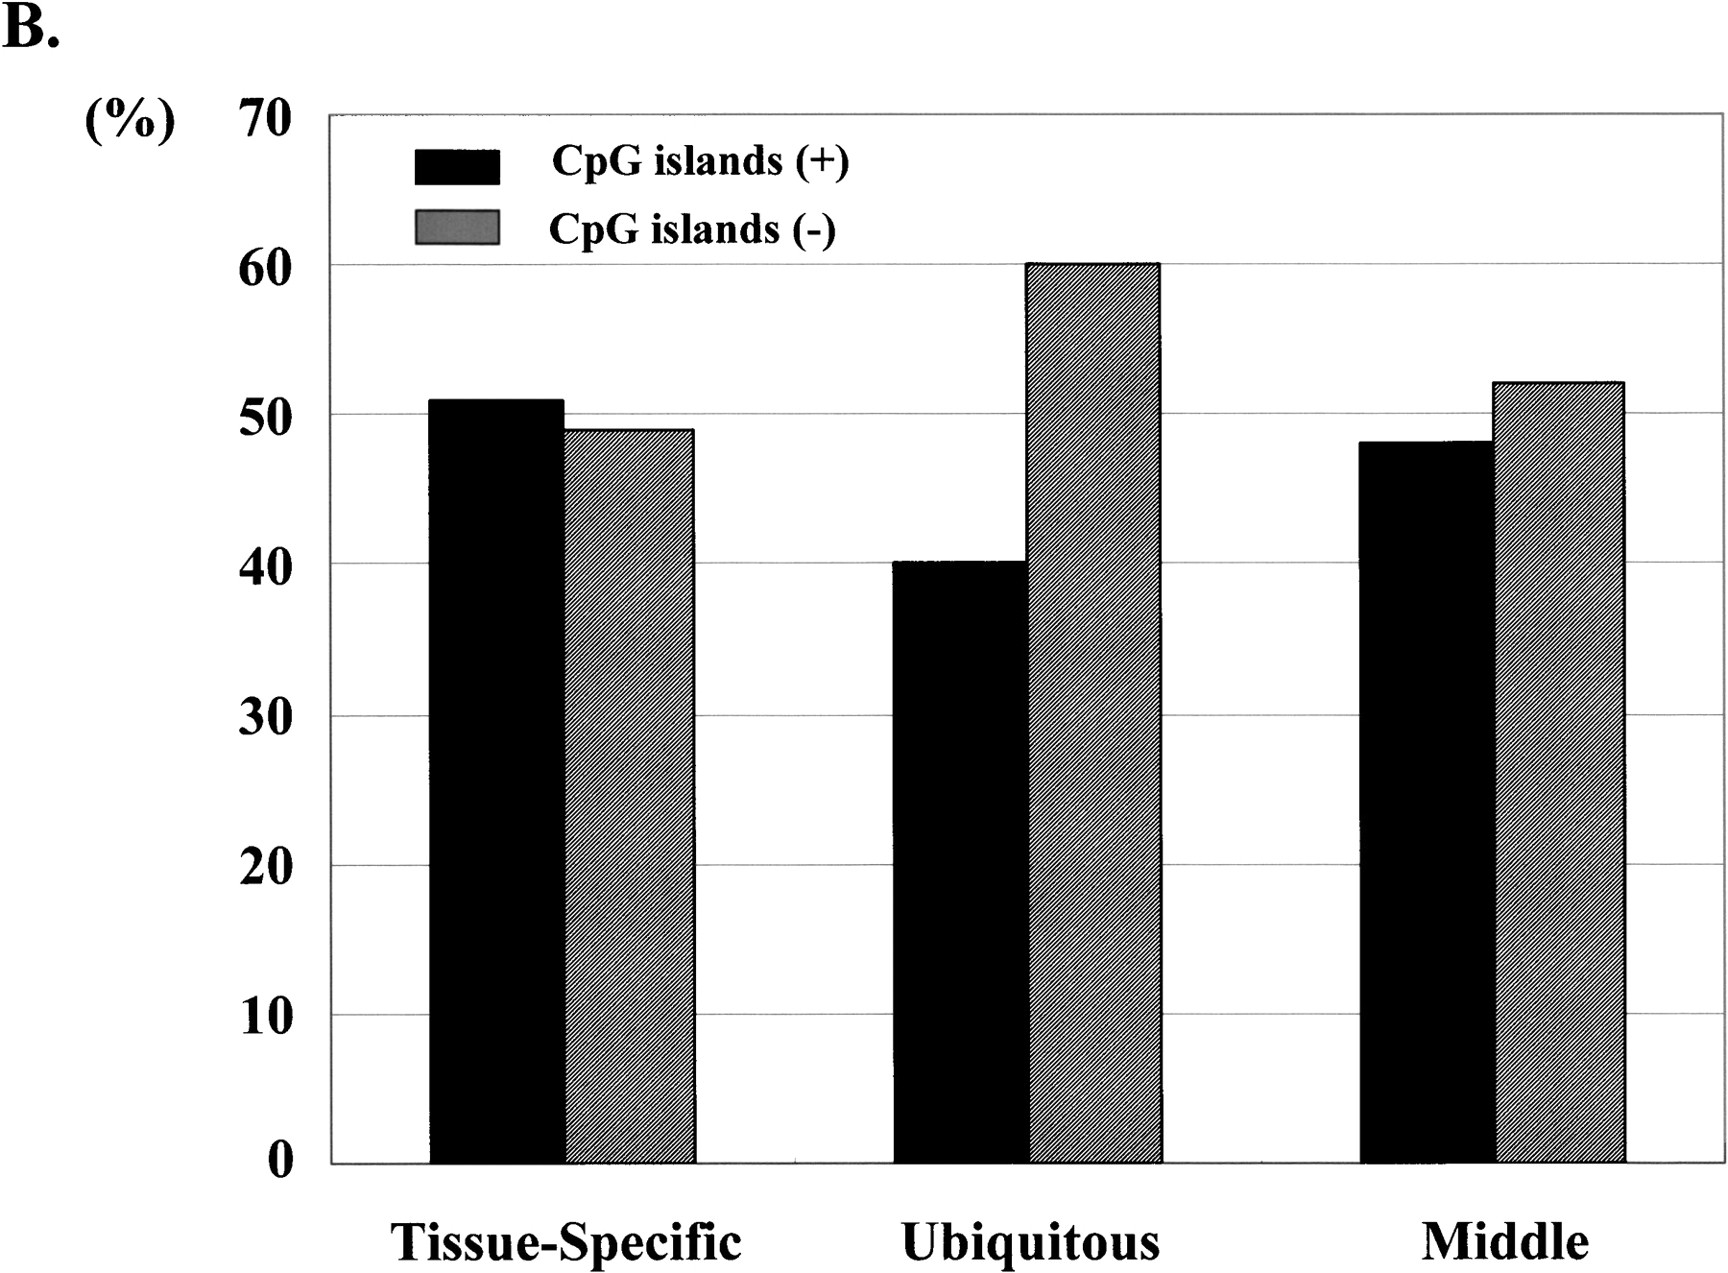
Figure 4.
(A) Expression profiles of chitinase 3-like 1(GeneRank no. 1), lipoamide beta(GeneRank no. 35), SUPT4H1(GeneRank no. 316), and mitochondrial-processing peptidase beta (GeneRank no. 350) observed by iAFLP. Vertical axes represent the relative expression level; horizontal axes represent the tissue distributions. The expression level was designated so that the total values should be 30. (B) Populations of tissue-specific, ubiquitous, and middle genes located in/outside of CpG islands. Solid bars represent population of potential promoter regions (PPRs) located in CpG islands; shaded bars represent PPRs outside of CpG islands.


