
Figure 1.
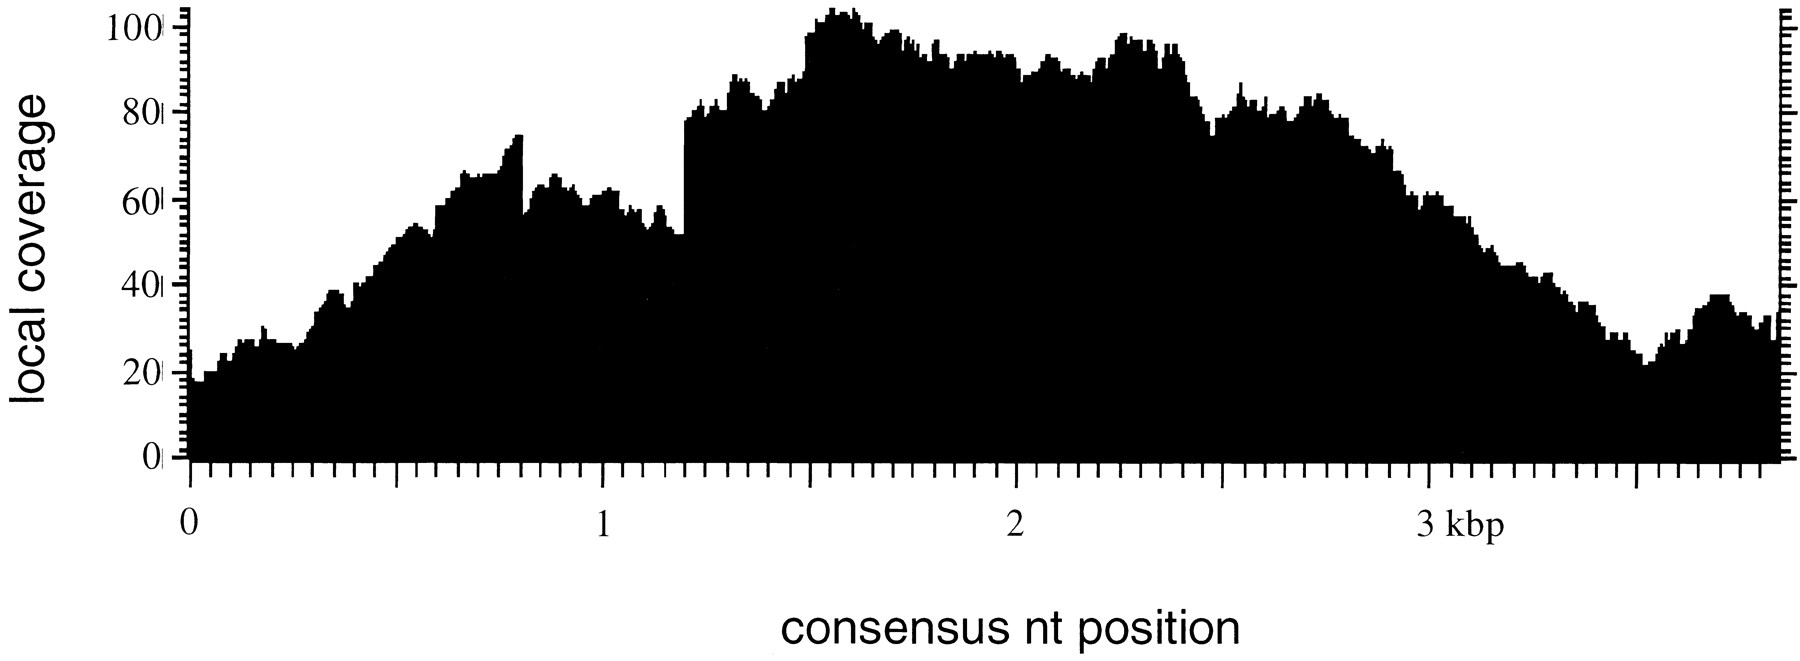
Coverage plot for element family Tdd-4 deduced from an alignment of 550 randomly chosen reads using CLUSTALW. Each base of the alignment is represented by a dot.
(Downloading may take up to 30 seconds. If the slide opens in your browser, select File -> Save As to save it.)
Click on image to view larger version.
Coverage plot for element family Tdd-4 deduced from an alignment of 550 randomly chosen reads using CLUSTALW. Each base of the alignment is represented by a dot.
 CiteULike
 Delicious
 Digg
Digg Facebook
 Google+
 Reddit
 Twitter
