
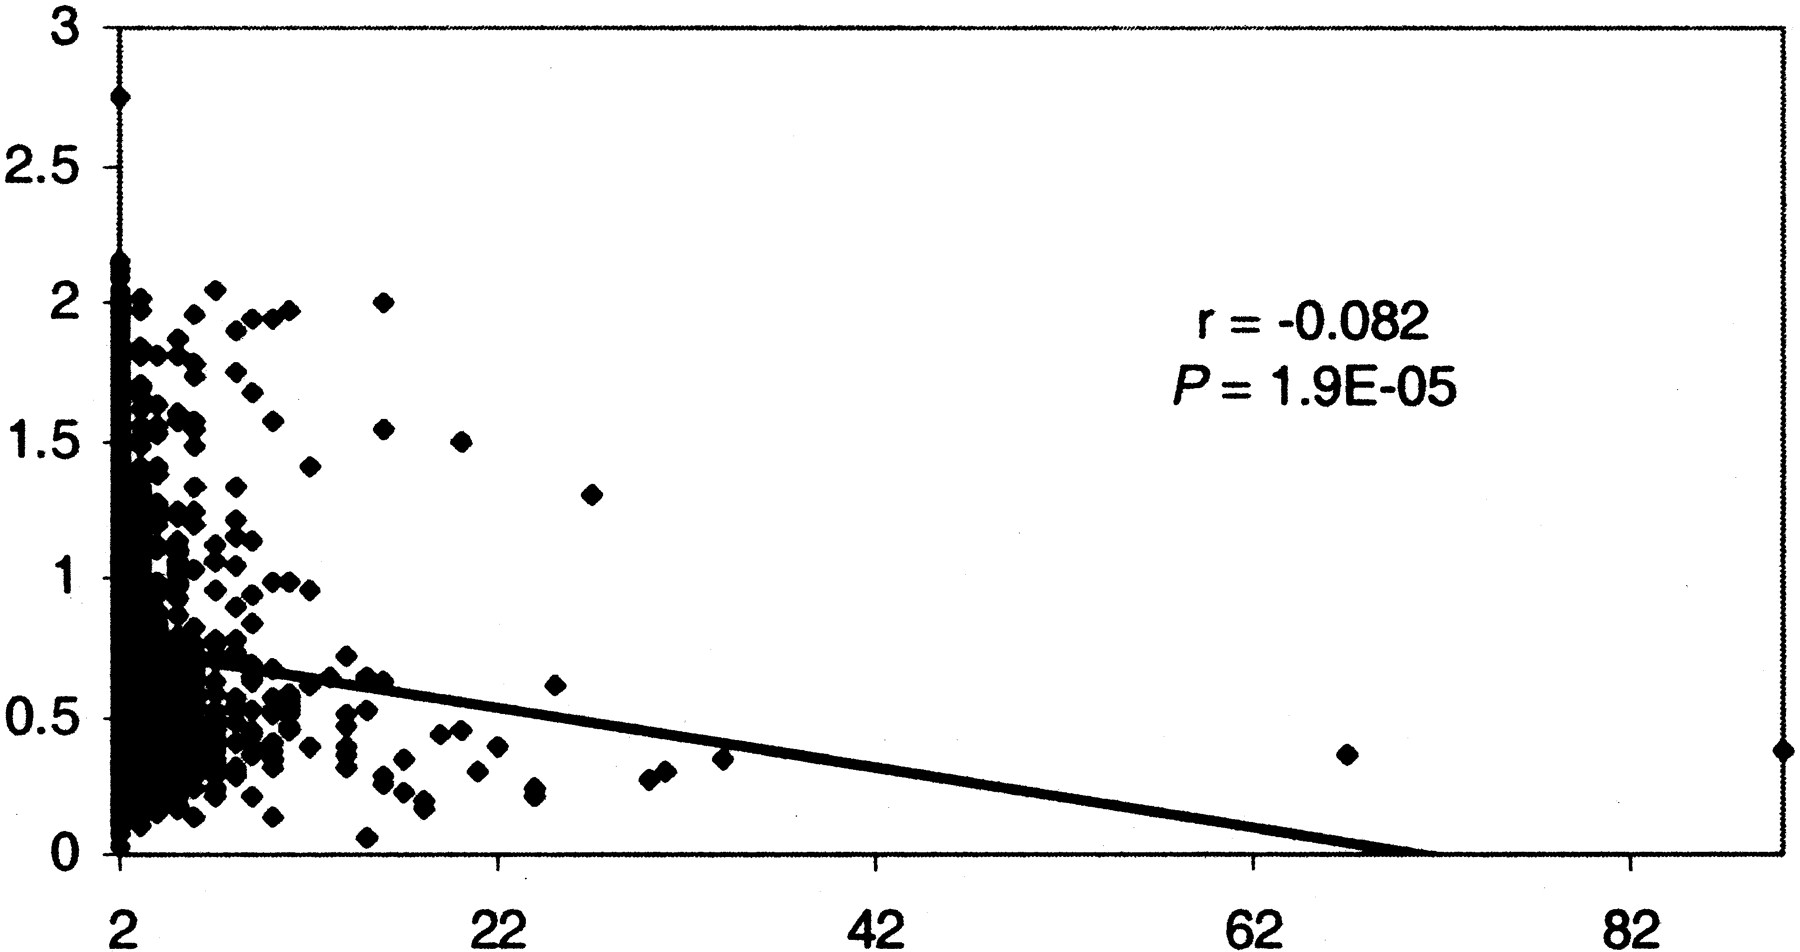
Figure 4.
Linear correlation between cluster size in number of genes (X-axis) and average score density per cluster (Y-axis). Correlation coefficients (r) and significance levels (P) were determined using ordinary least squares linear regression. Removal of the two largest clusters (size 67 and 90) results in a greater magnitude of r and a lowerP value (i.e., a stronger negative correlation).


