
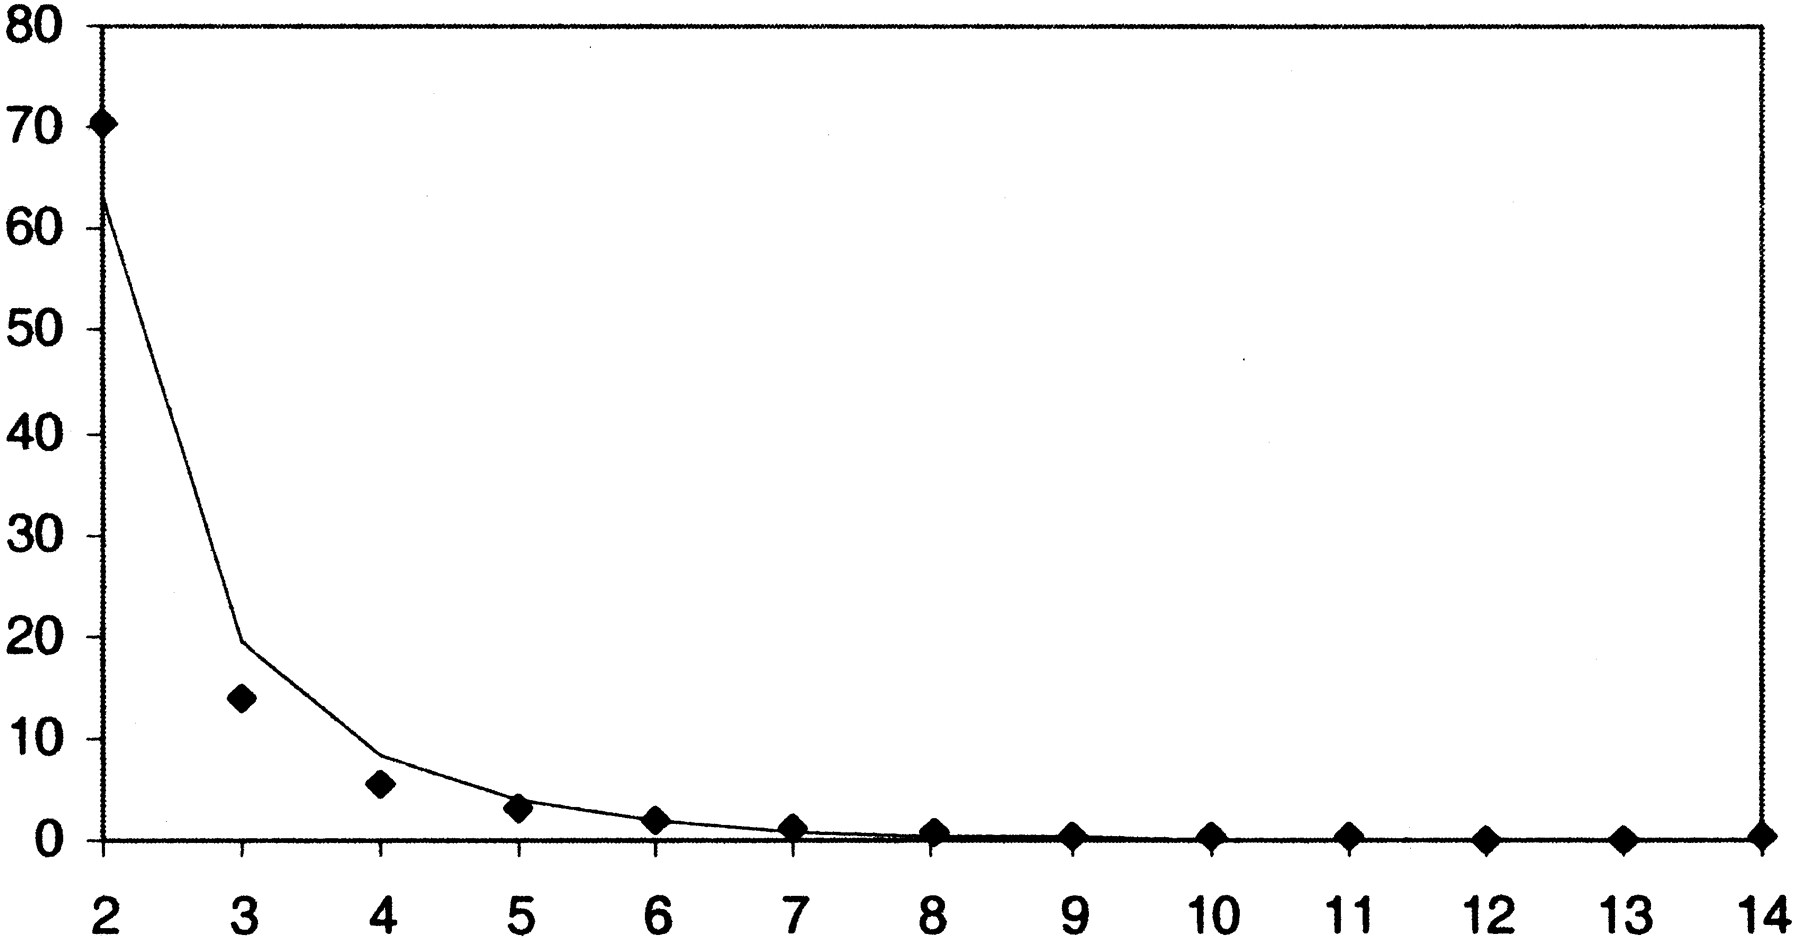
Figure 3.
Frequency distribution (99% quantile) of lineage-specific expansion cluster sizes (X-axis in numbers of genes). Observed data are shown with diamonds. These data were fit using the logarithmic approximation (line).


