
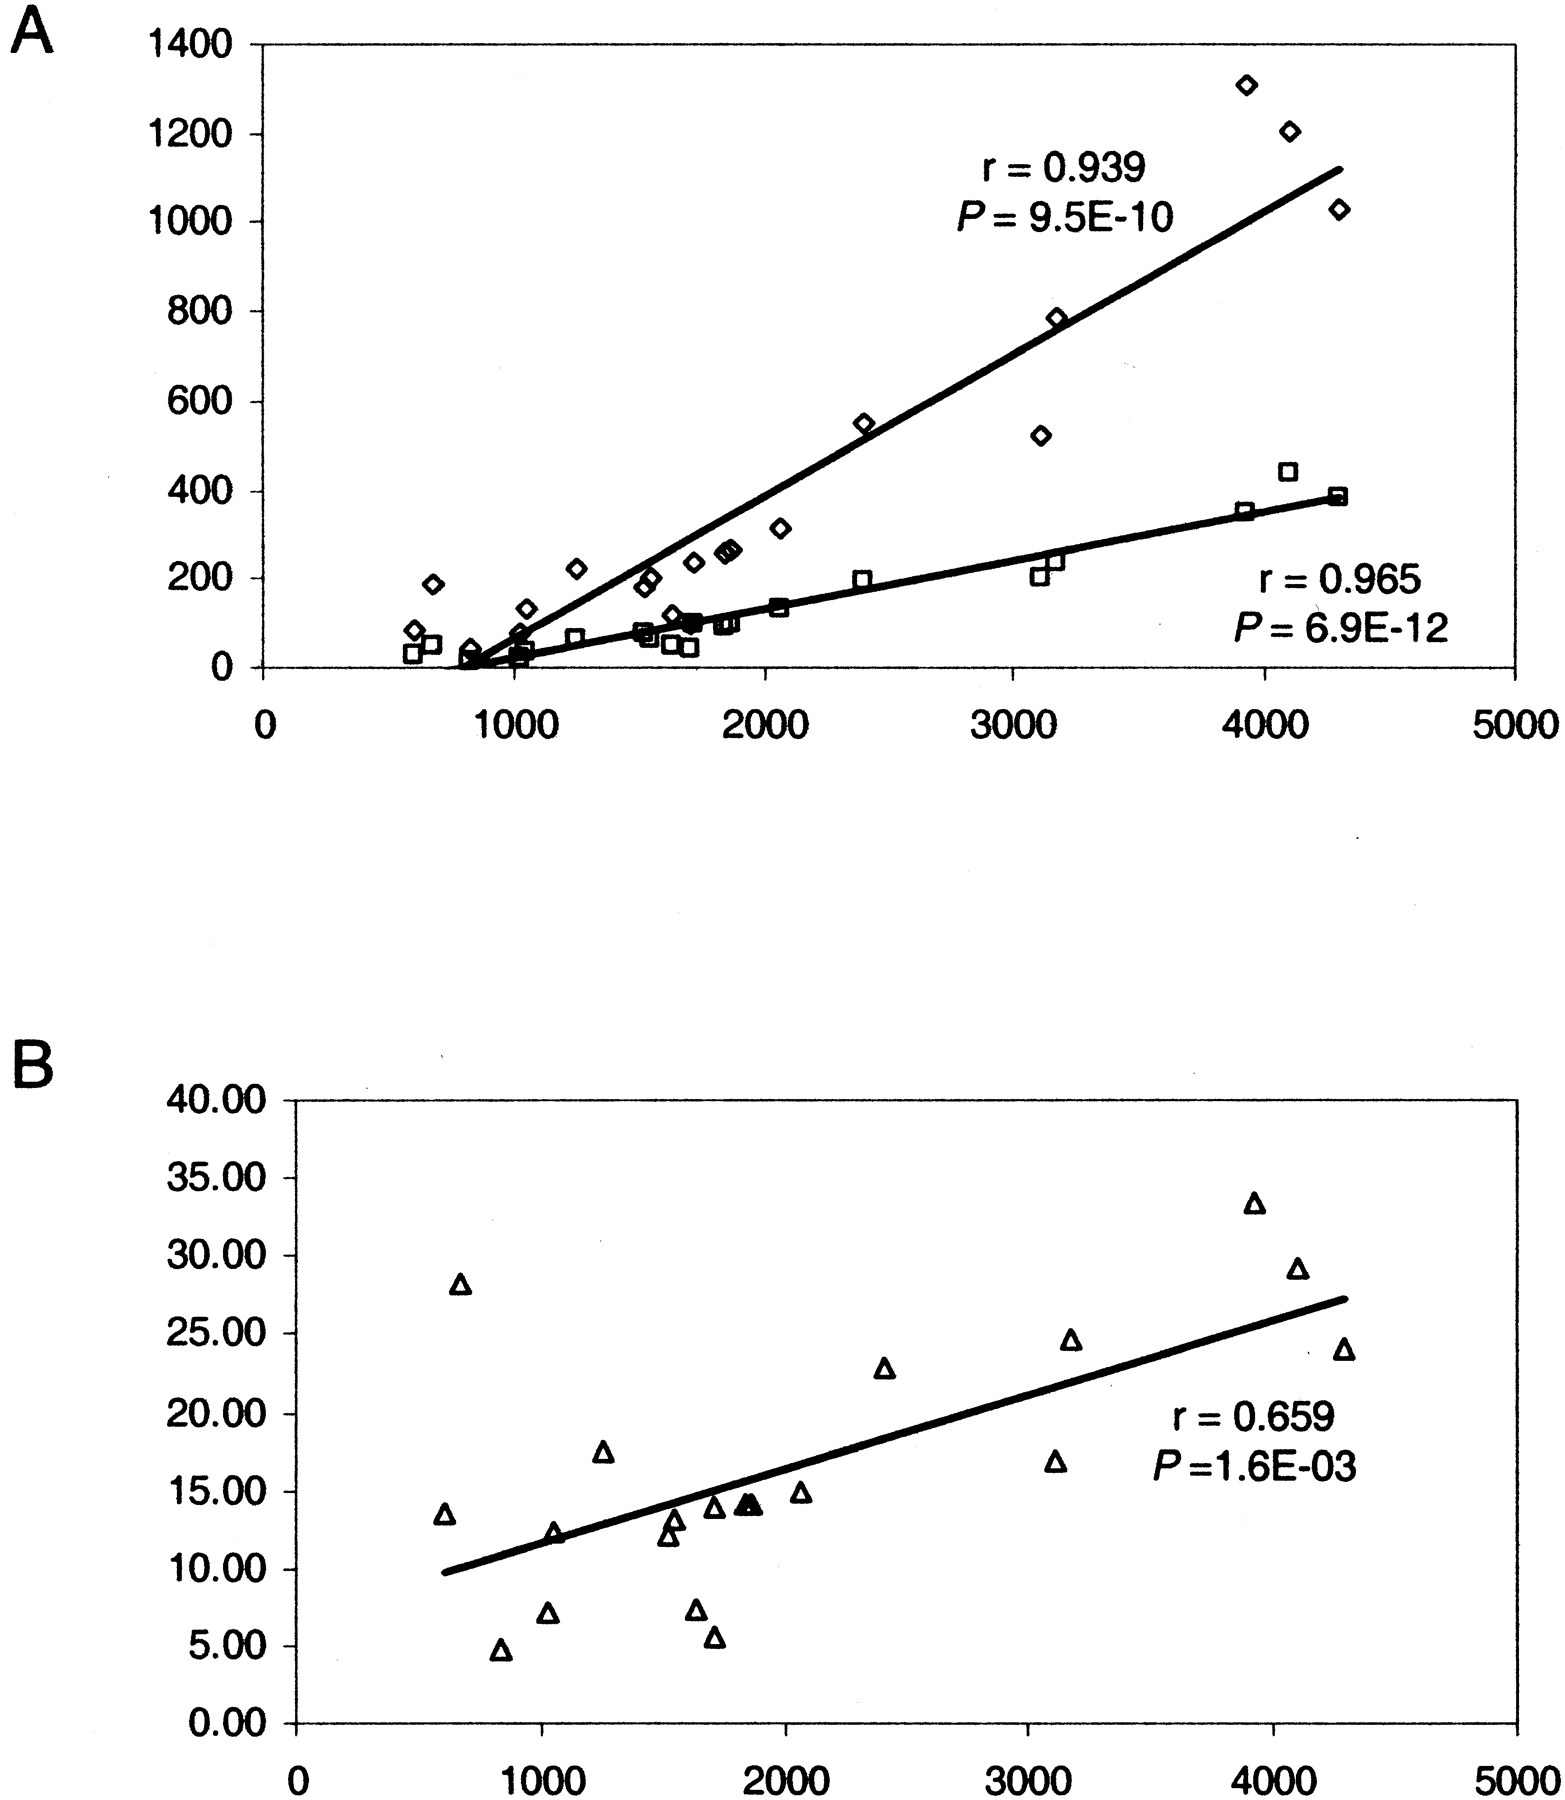
Figure 2.
Linear correlation between genome size (in number of genes) and the parameters of lineage-specific expansions. Correlation coefficients (r) and significance levels (P) were determined using ordinary least squares linear regression. (A) For completely sequenced prokaryotic genomes, genome size (X-axis) is plotted against the number of genes in lineage-specific clusters (diamonds) and the number of such clusters (squares). (B) Genome size (X-axis) is plotted against the percentage of the genome made up of lineage-specific clusters (triangles).


