
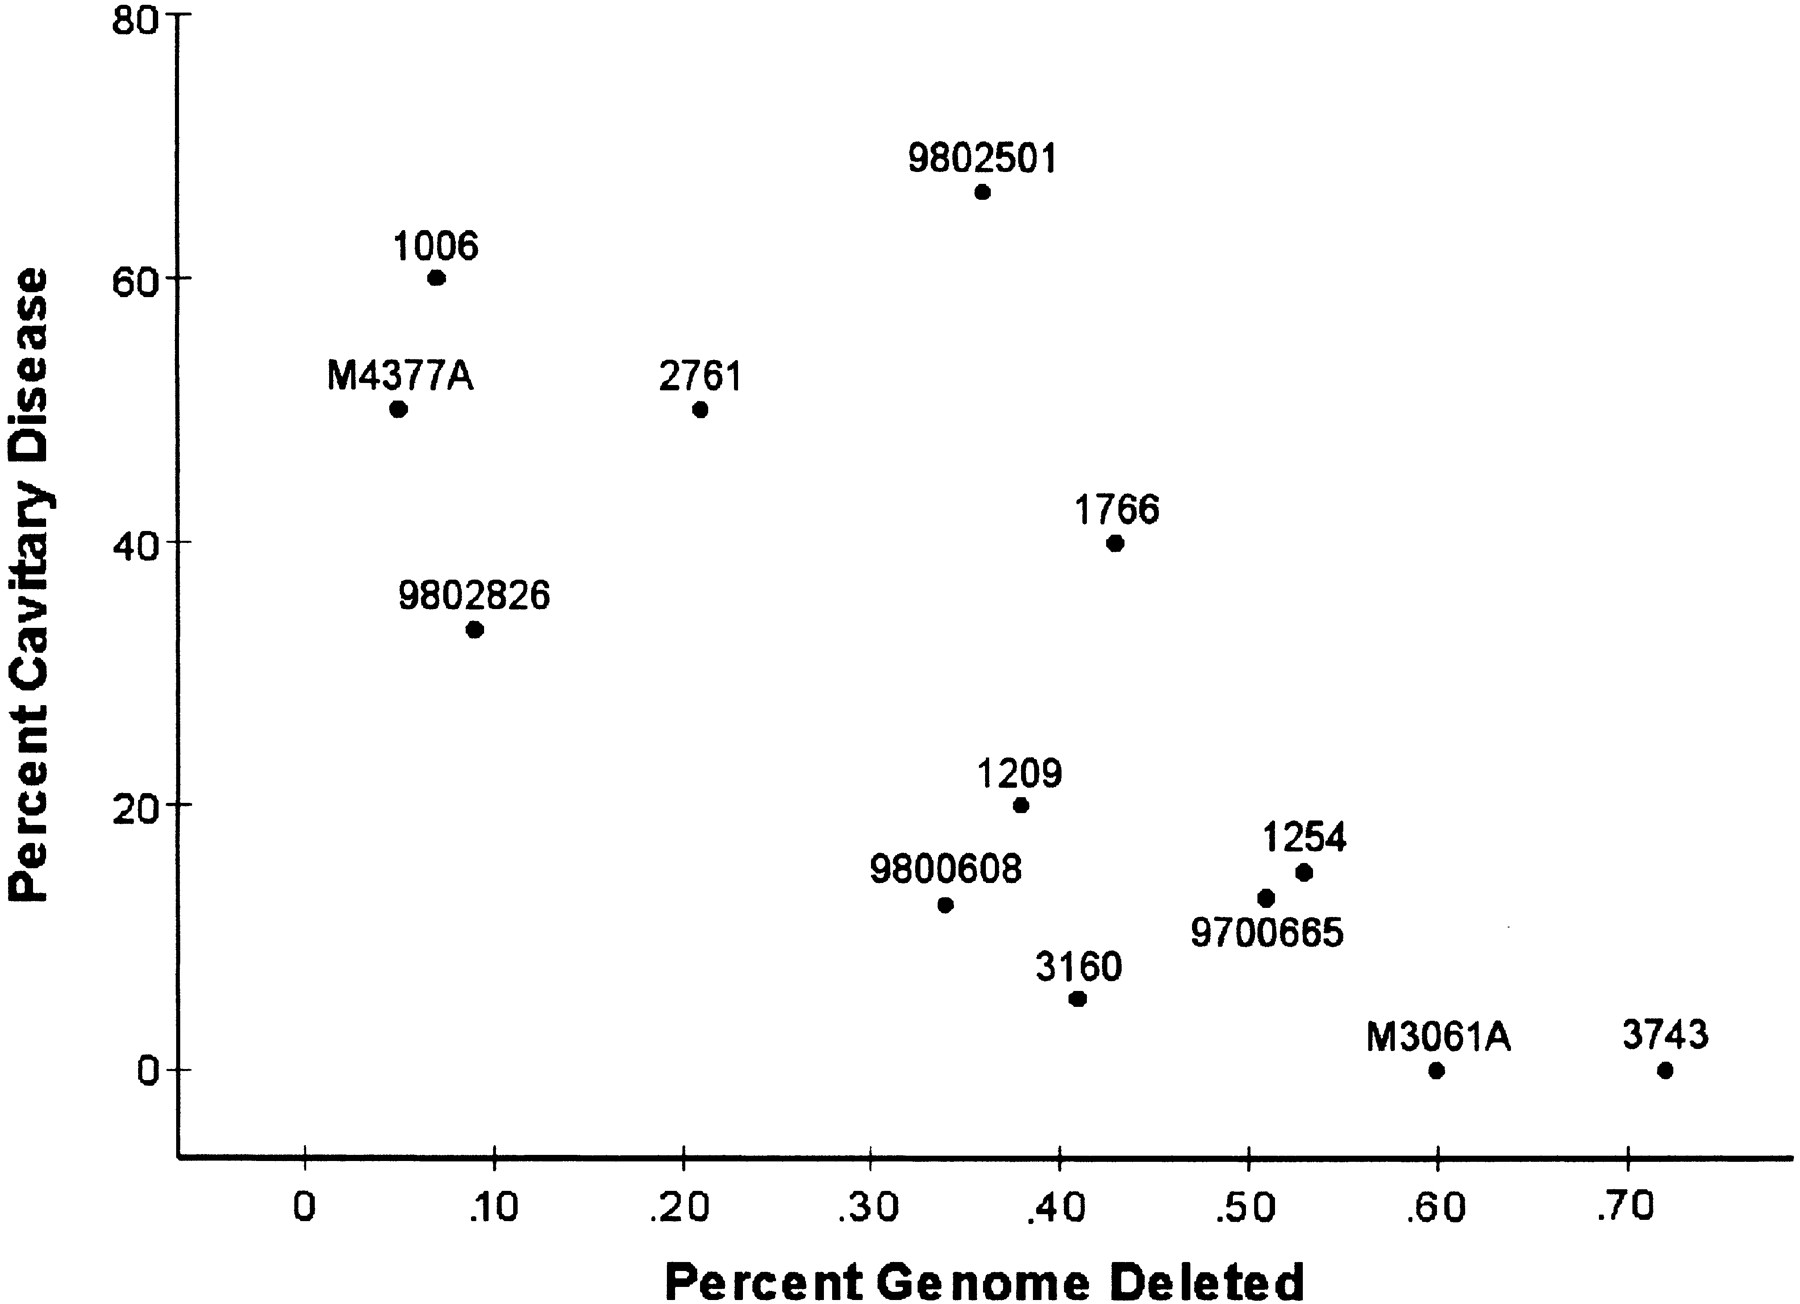
Figure 2.
Clinical phenotype correlated to genomic deletions showing that pathogenicity decreases as deletions accumulate (R = −0.73; P = 0.0047). The percentage of the mycobacterial sequence that is deleted from each clone (X-axis) is plotted against the percentage of persons infected with that clone who have cavitary pulmonary disease (Y-axis). Points are labeled by isolate identification number.


