
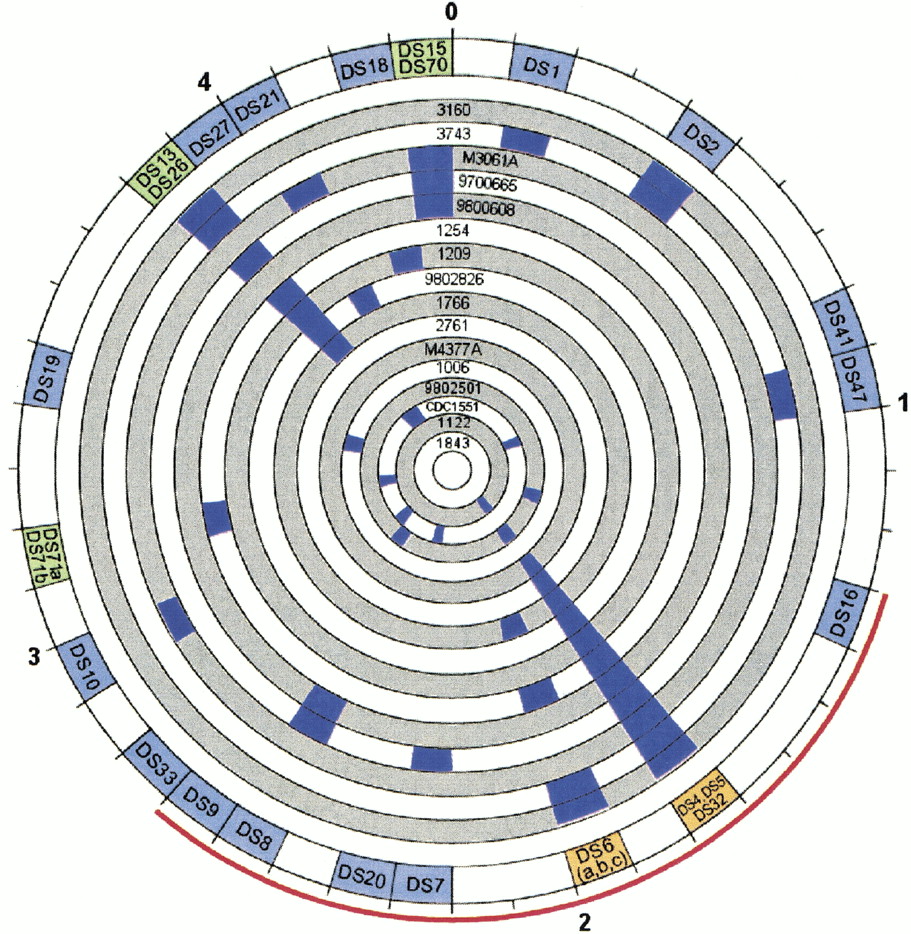
Circular map of genomic deletions among Mycobacterium tuberculosis showing that the pattern of deletions differs between clones and is not spatially random. The outer numbers shows the scale in mega base pairs, with 0 representing the origin of replication. Each of the inner circles represents 1 of 16 clinical clones, labeled by isolate identification number. The blue regions denote the genomic locations of deleted sequences. The outer circle summarizes the sum of all detected deletions (each denoted by their identification number). Color of deletion regions varies by number of detected deletions within the 100-kb segment (light blue, 1 deletion; light green, 2 deletions; orange, 3 deletions). The thin red line spans the genomic region of the genome where the number of deletions detected is greater than that expected by chance alone.


