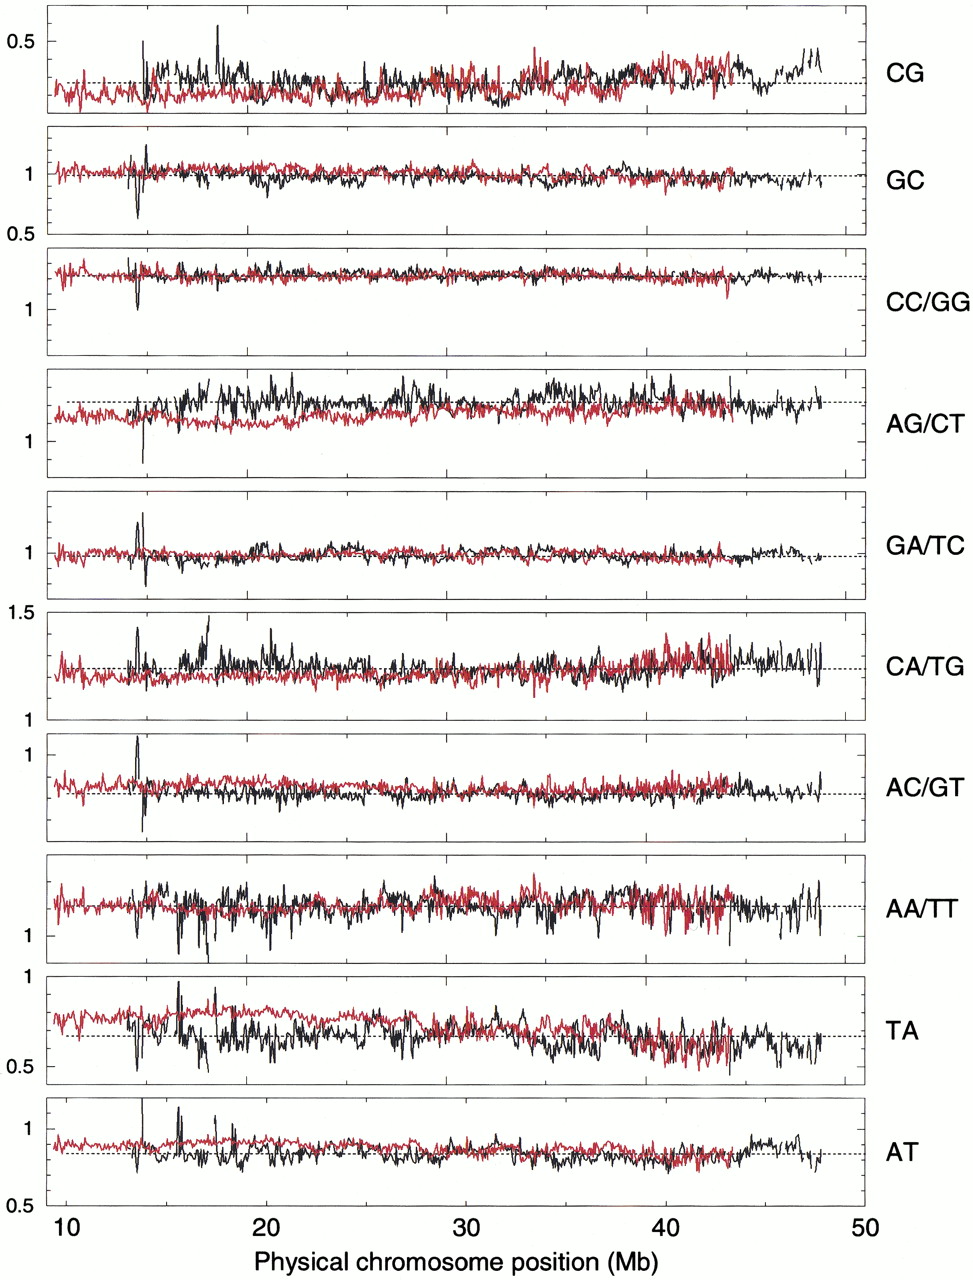
Genome-Scale Compositional Comparisons in Eukaryotes

(Downloading may take up to 30 seconds. If the slide opens in your browser, select File -> Save As to save it.)

Click on image to view larger version.

Figure 2.
Figure 2.

Variation of ρ* across human chromosomes 21 (red) and 22 (black) for each unique dinucleotide. The horizontal scale is identical in all graphs. Each vertical scale graduation is 0.1 in ρ*.

This Article

  1. Genome Res. 11: 540-546

Preprint Server