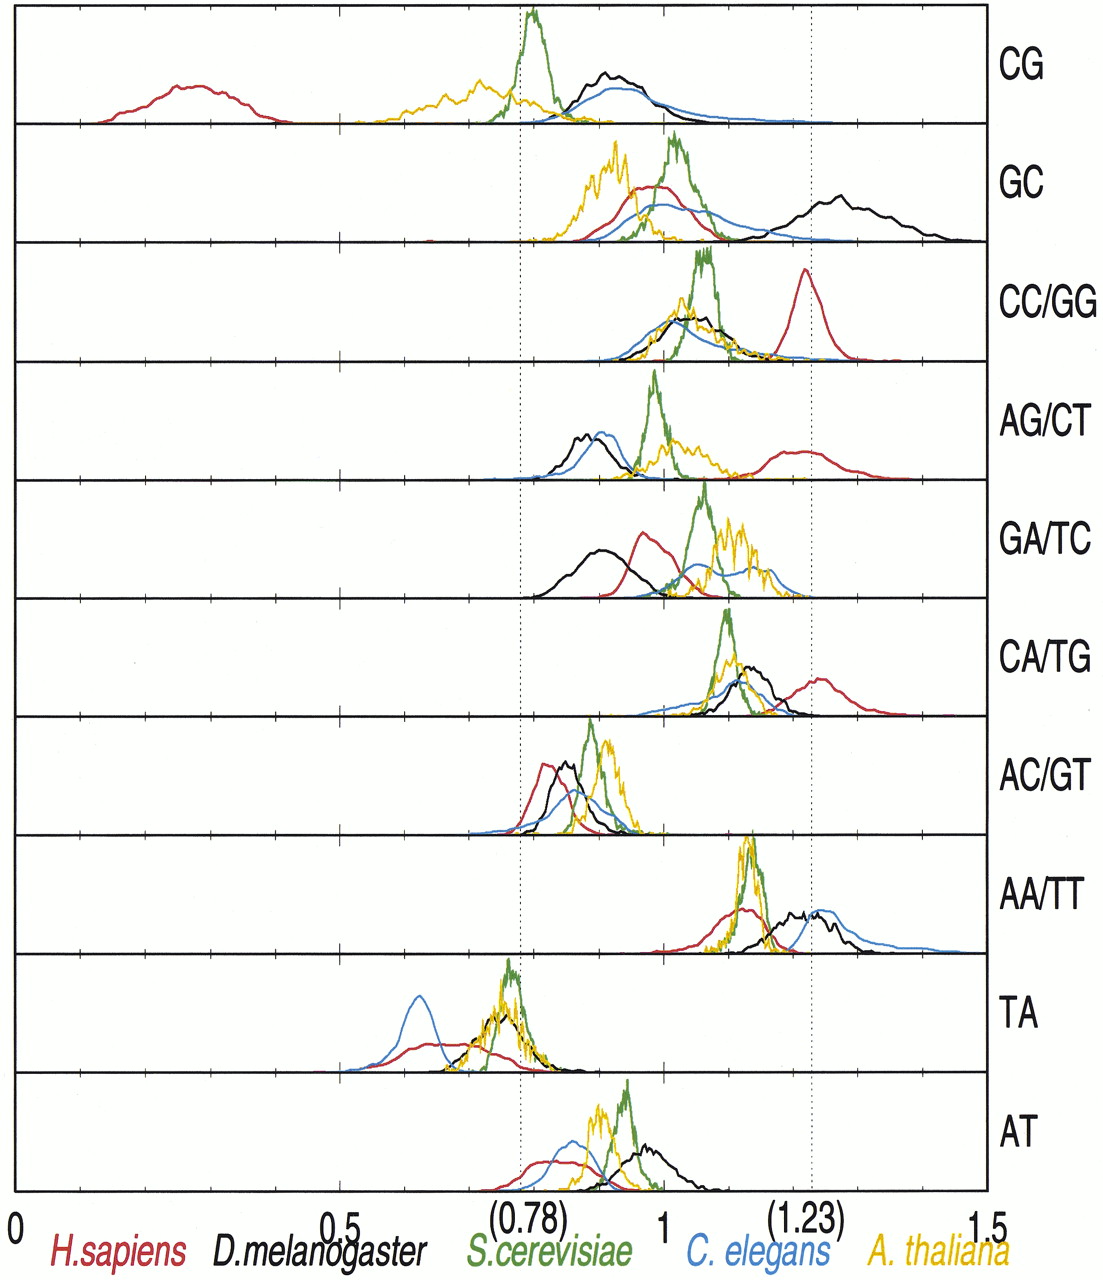
Genome-Scale Compositional Comparisons in Eukaryotes

(Downloading may take up to 30 seconds. If the slide opens in your browser, select File -> Save As to save it.)

Click on image to view larger version.

Figure 1.
Figure 1.

Distribution of ρ* values for all 50-kb samples from human (red),Drosophila melanogaster (black), Saccharomyces cerevisiae (green), Caenorhabditis elegans (blue), andArabidopsis thaliana (orange).

This Article

  1. Genome Res. 11: 540-546

Preprint Server