
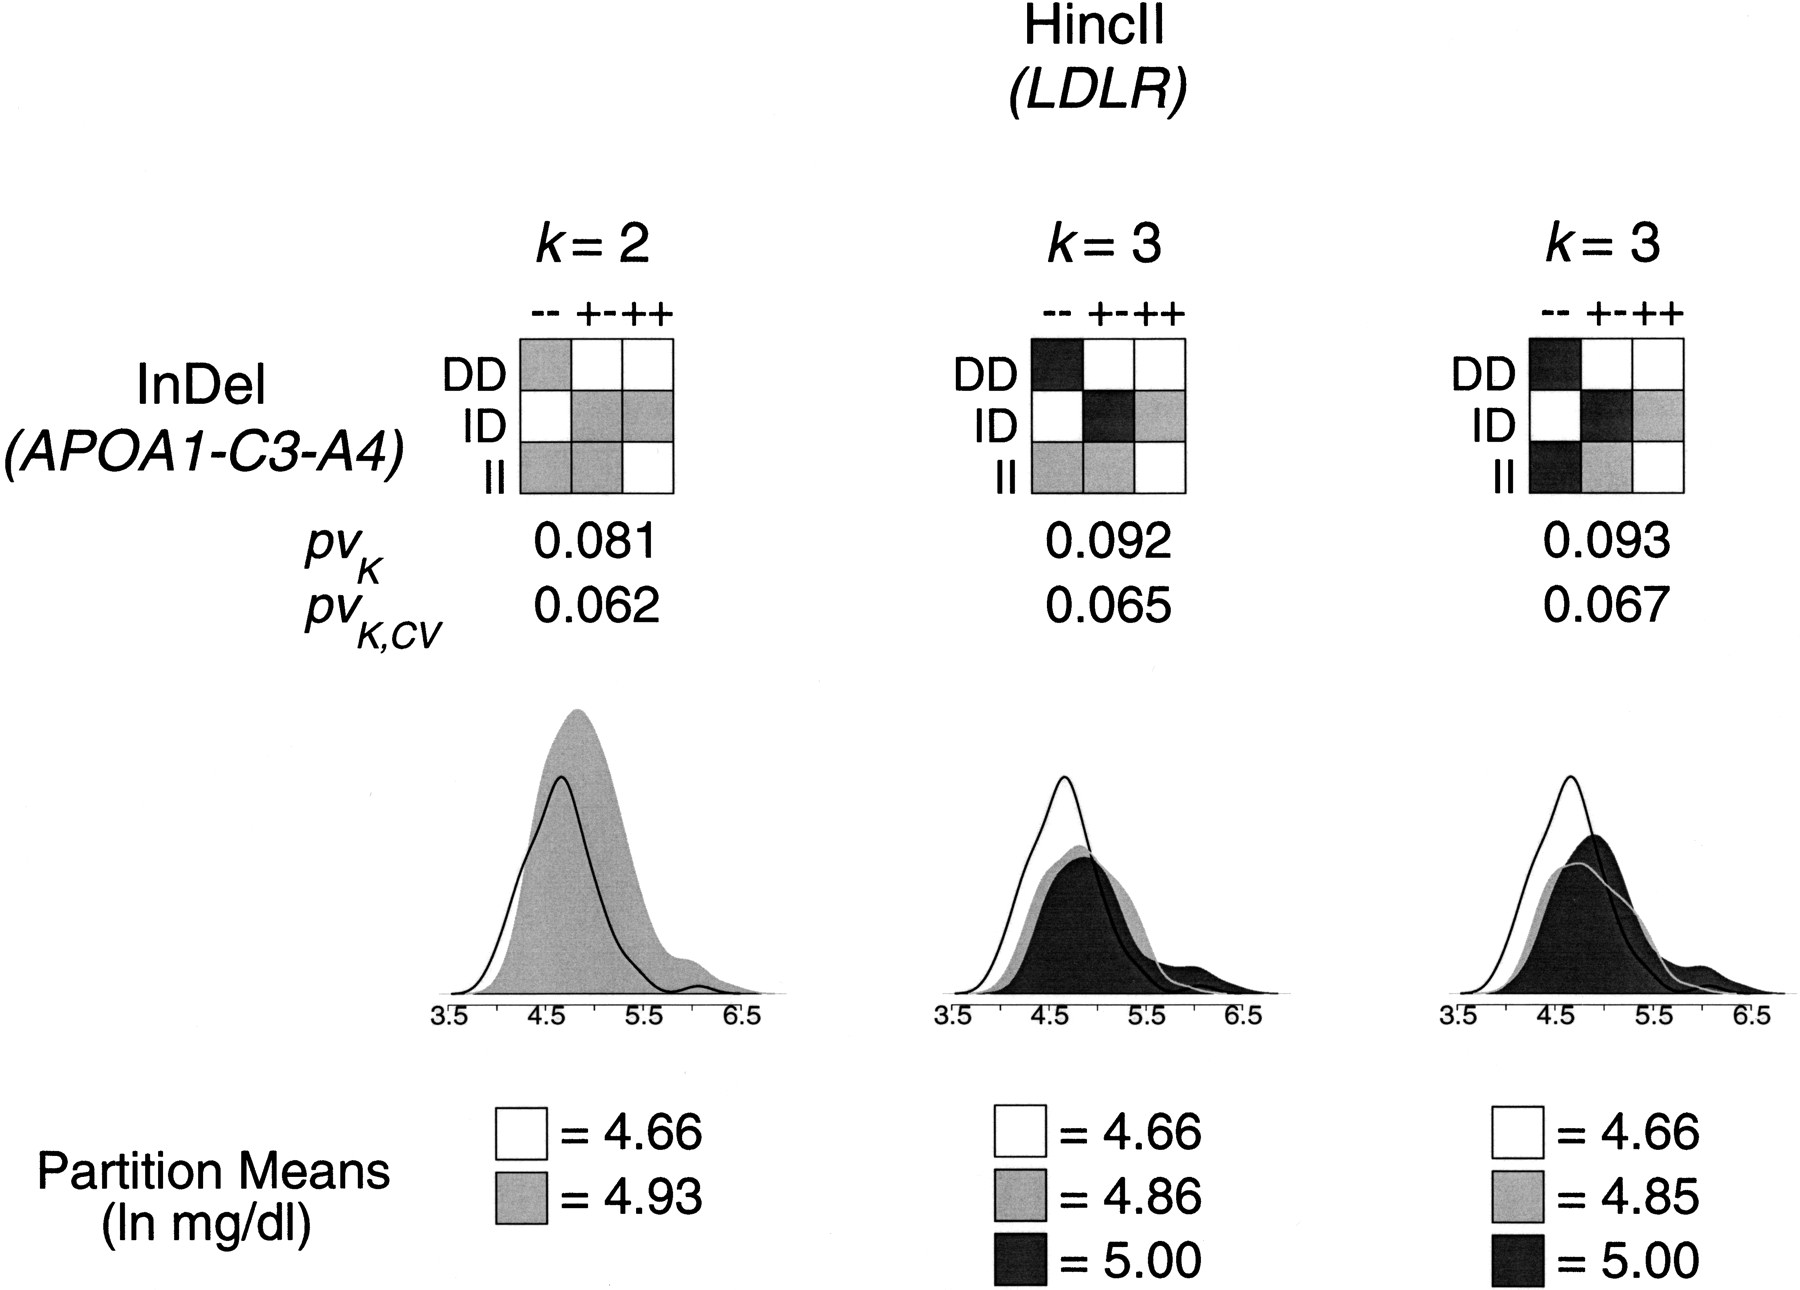
Figure 7.
The three selected sets of genotypic partitions with the greatest proportion of cross-validated variability explained are represented by a 3 × 3 grid of nine two-locus genotypes with shading to represent the partition each genotype belongs to. Below each partition is a smoothed histogram showing the ln Trig distribution within each partition (indicated by shading) and the mean and sample size of each partition.


