
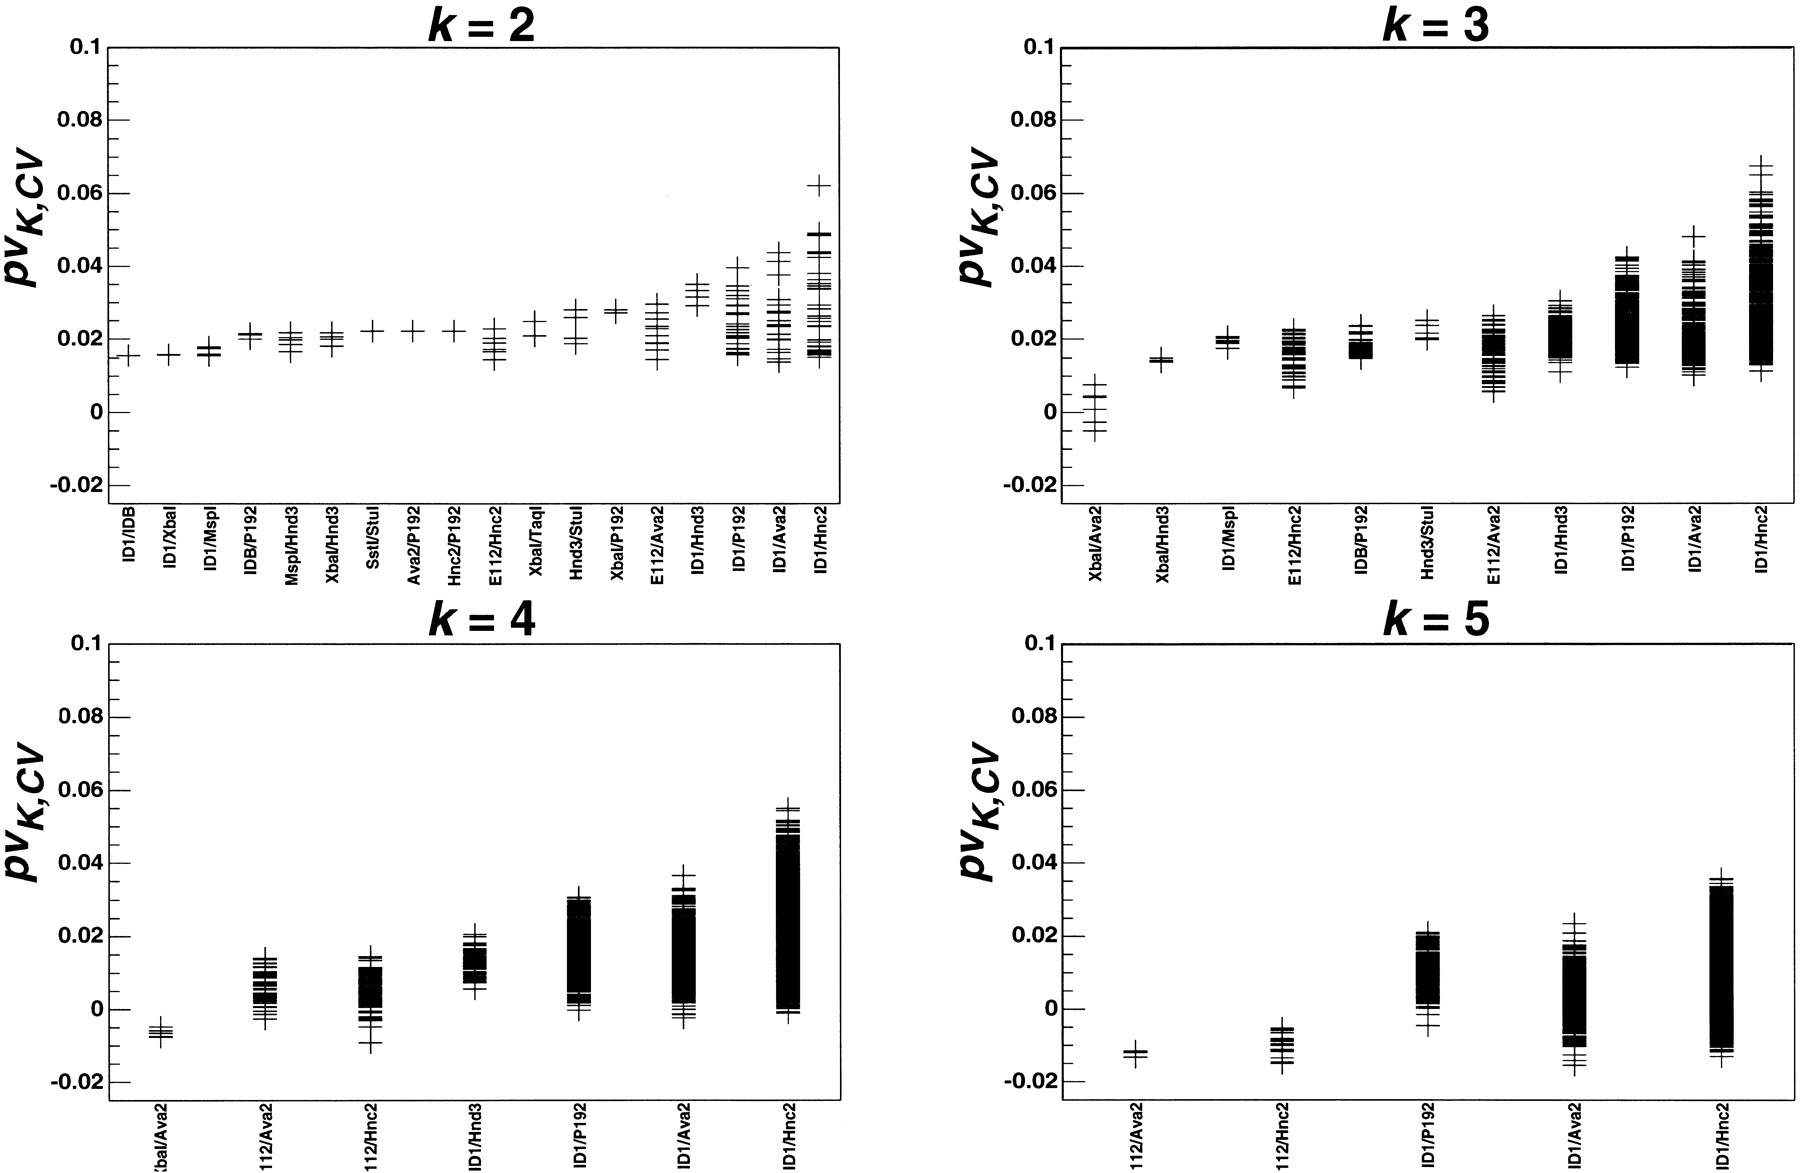
Figure 6.
Plot of the proportion of cross-validated variability explained by the same sets shown in Figure 5, after grouping by the pairs of variable loci included in each set and sorting groups by the proportion of variability explained by the best partition for each group.


