
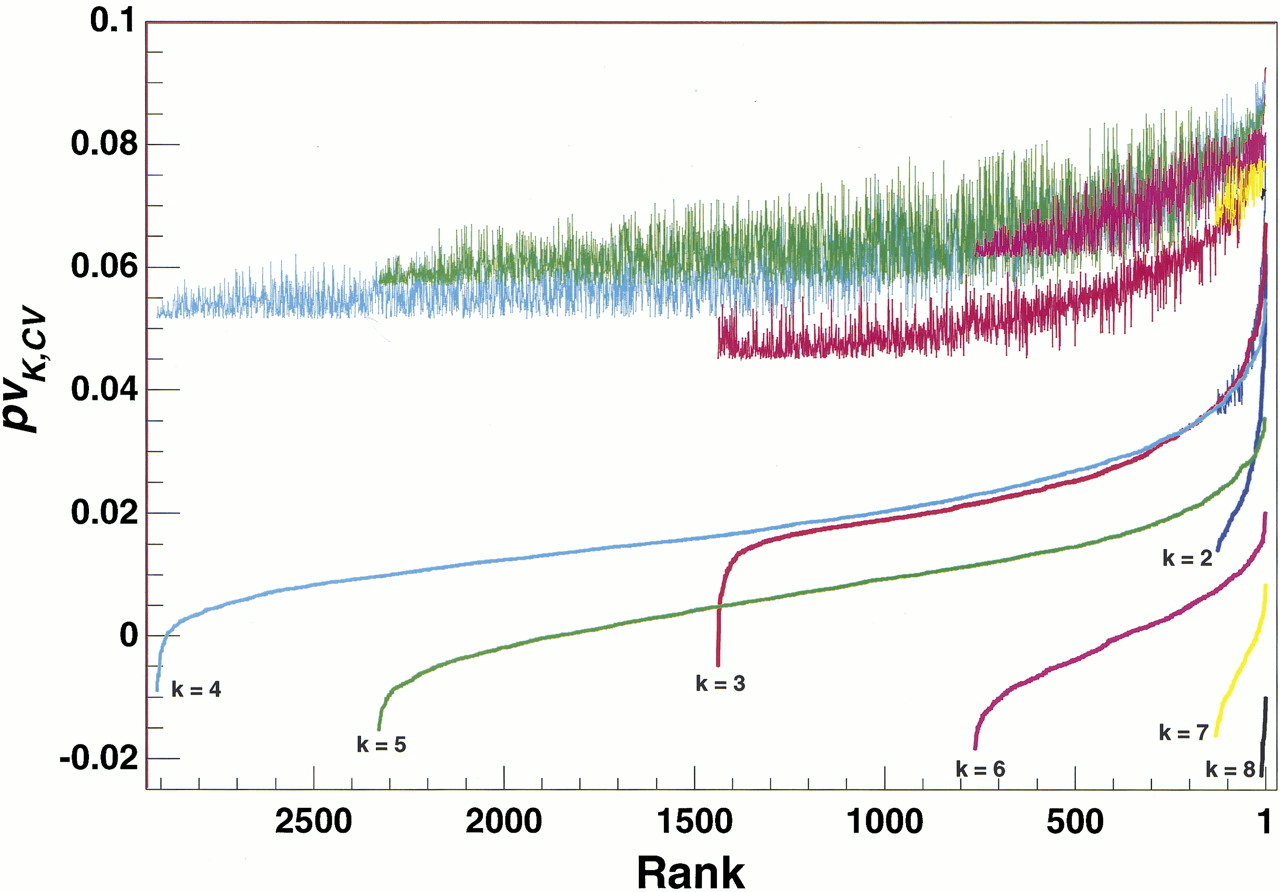
Figure 5.
Plot of the cross-validated proportion of variability explained by the 7710 retained sets of genotypic partitions. The sets are sorted by the proportion of variability explained and connected by a colored line corresponding to the number of partitions in each set (smooth, nondecreasing lines). The proportion of variability explained for each set before cross-validation is shown by the jagged lines of corresponding colors.


