
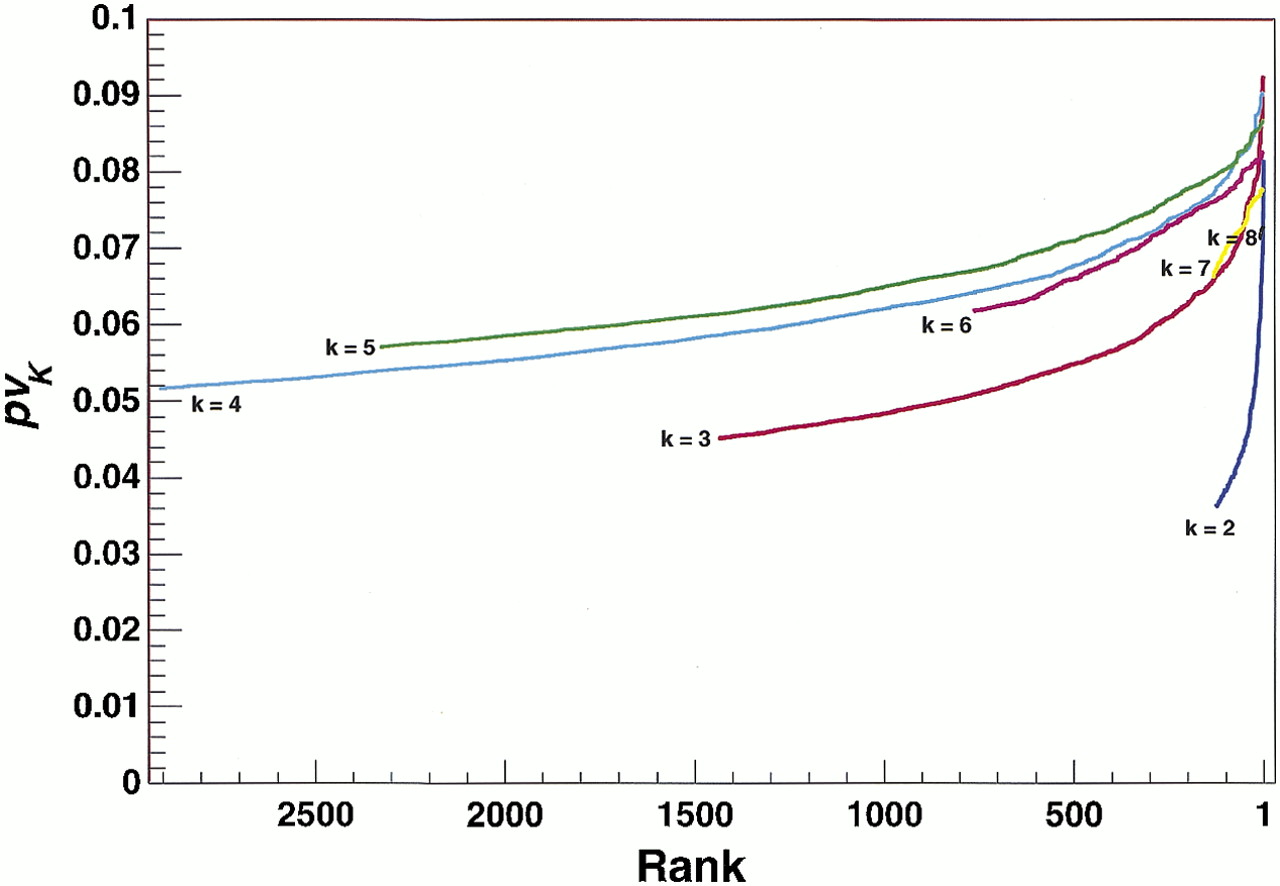
Figure 3.
Plot of the proportion of variability explained by the 7710 retained sets of genotypic partitions. The sets are sorted by the proportion of variability explained and connected by a colored line corresponding to the number of partitions in each set.


