
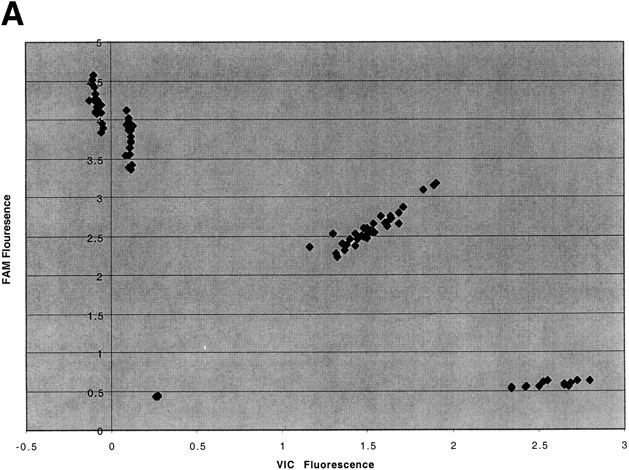
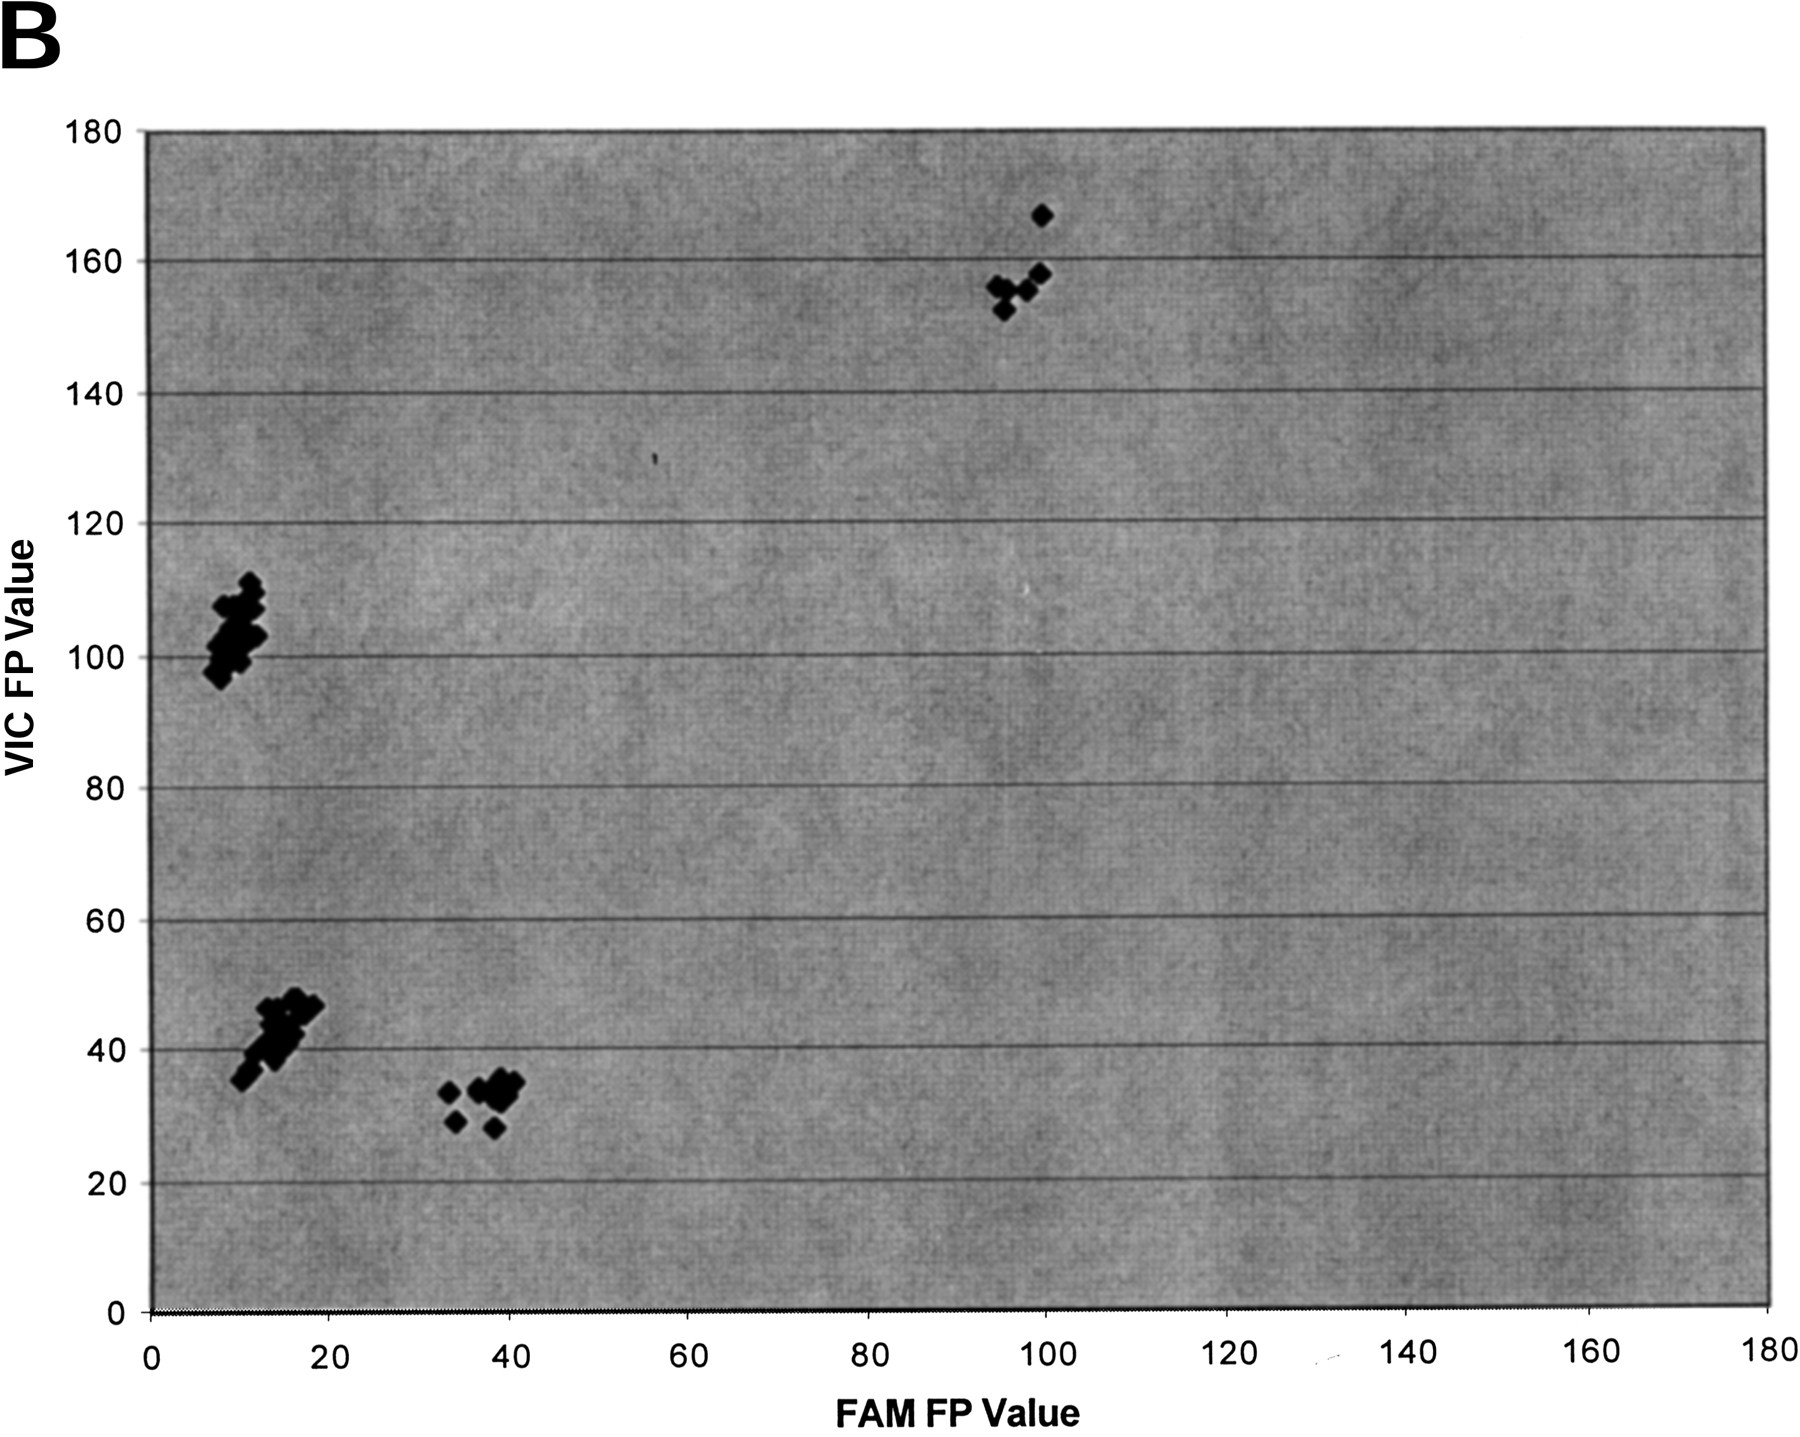
Figure 2.
Scatter plot of the results of 5′-nuclease assay with marker D2S1301 on 90 individuals. (A) Fluorescence intensity analysis. (B) Normalized fluorescence polarization analysis.
(Downloading may take up to 30 seconds. If the slide opens in your browser, select File -> Save As to save it.)
Click on image to view larger version.
Scatter plot of the results of 5′-nuclease assay with marker D2S1301 on 90 individuals. (A) Fluorescence intensity analysis. (B) Normalized fluorescence polarization analysis.
 CiteULike
 Delicious
 Digg
Digg Facebook
 Google+
 Reddit
 Twitter
