
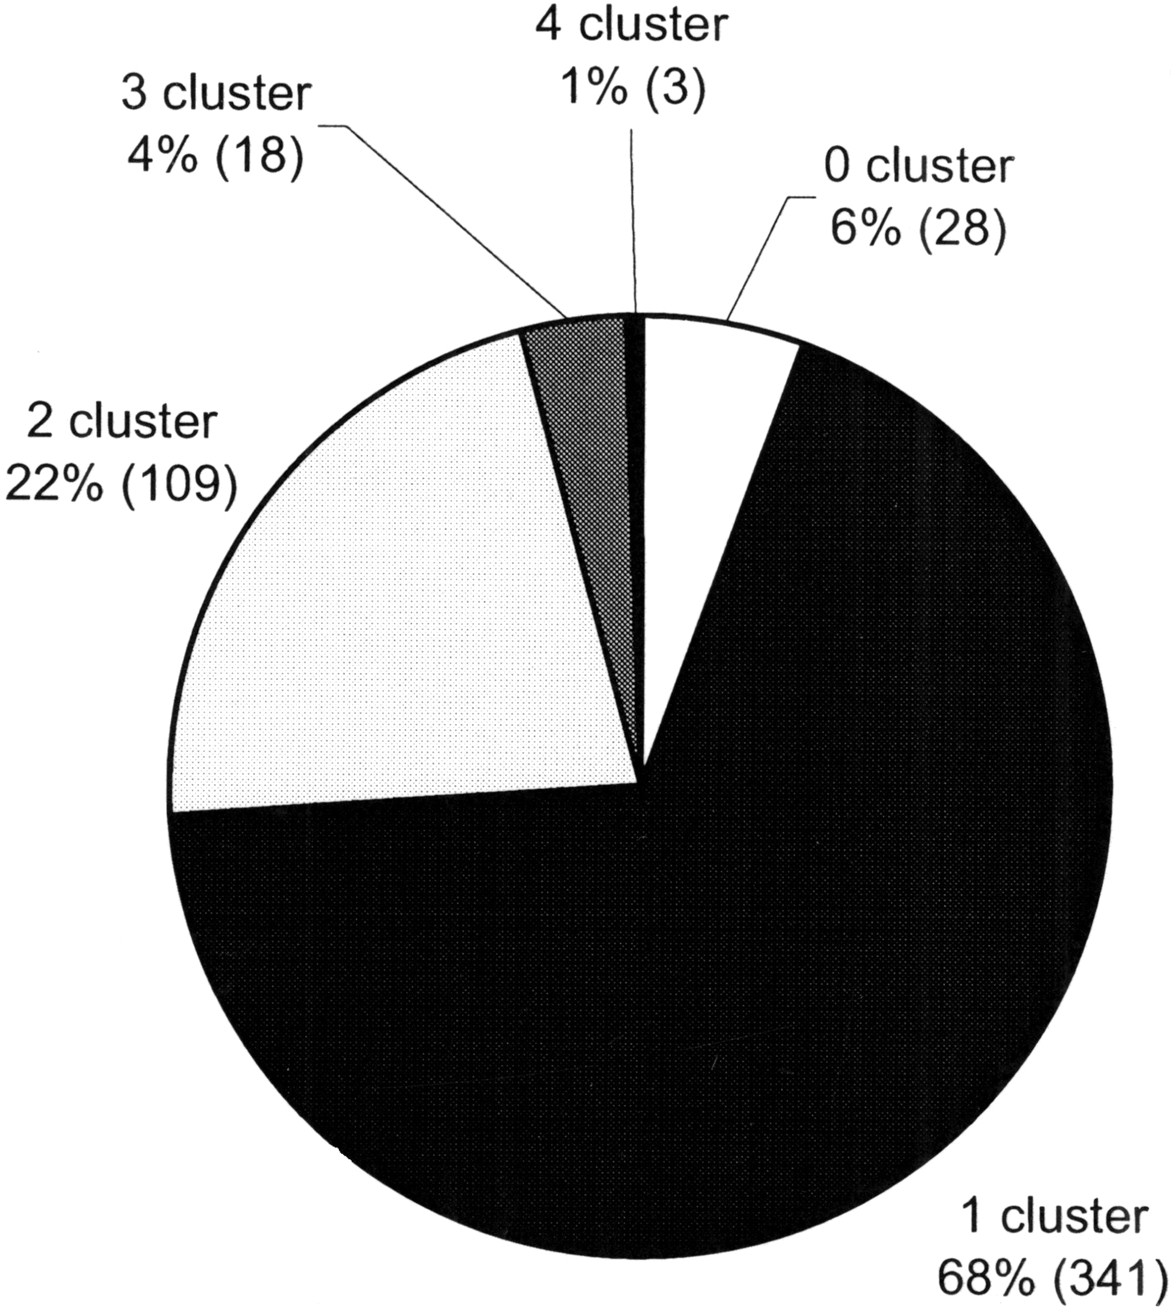
Figure 3.
Representation of cDNAs in the UniGene data set (Build 105). Every cDNA was aligned with the UniGene data set to identify the number of EST clusters that was hit/joined with a given cDNA. The fraction and the total number (in parentheses) of the cDNAs are given for the varying numbers of clusters being hit.


