
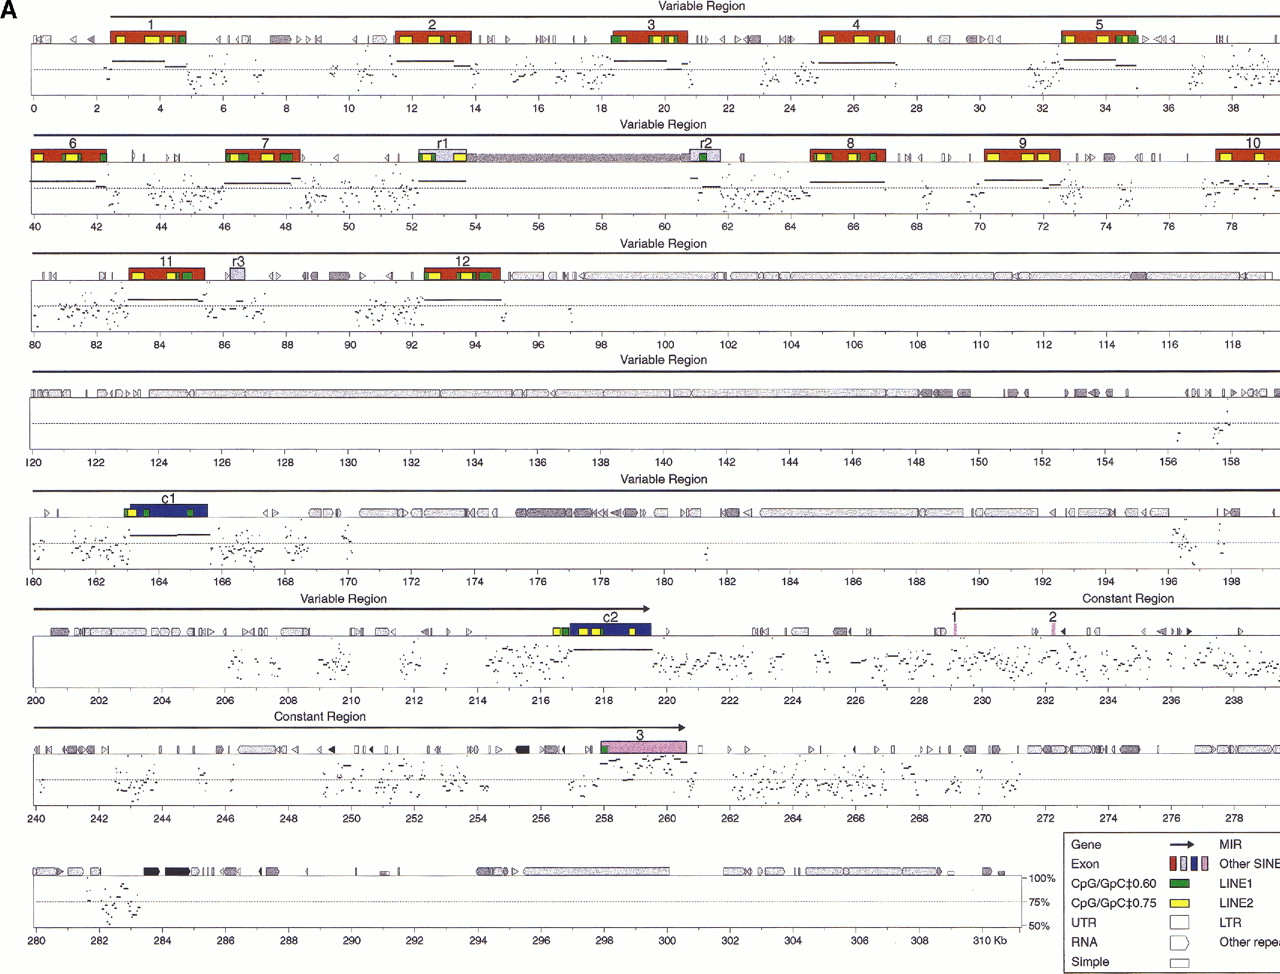
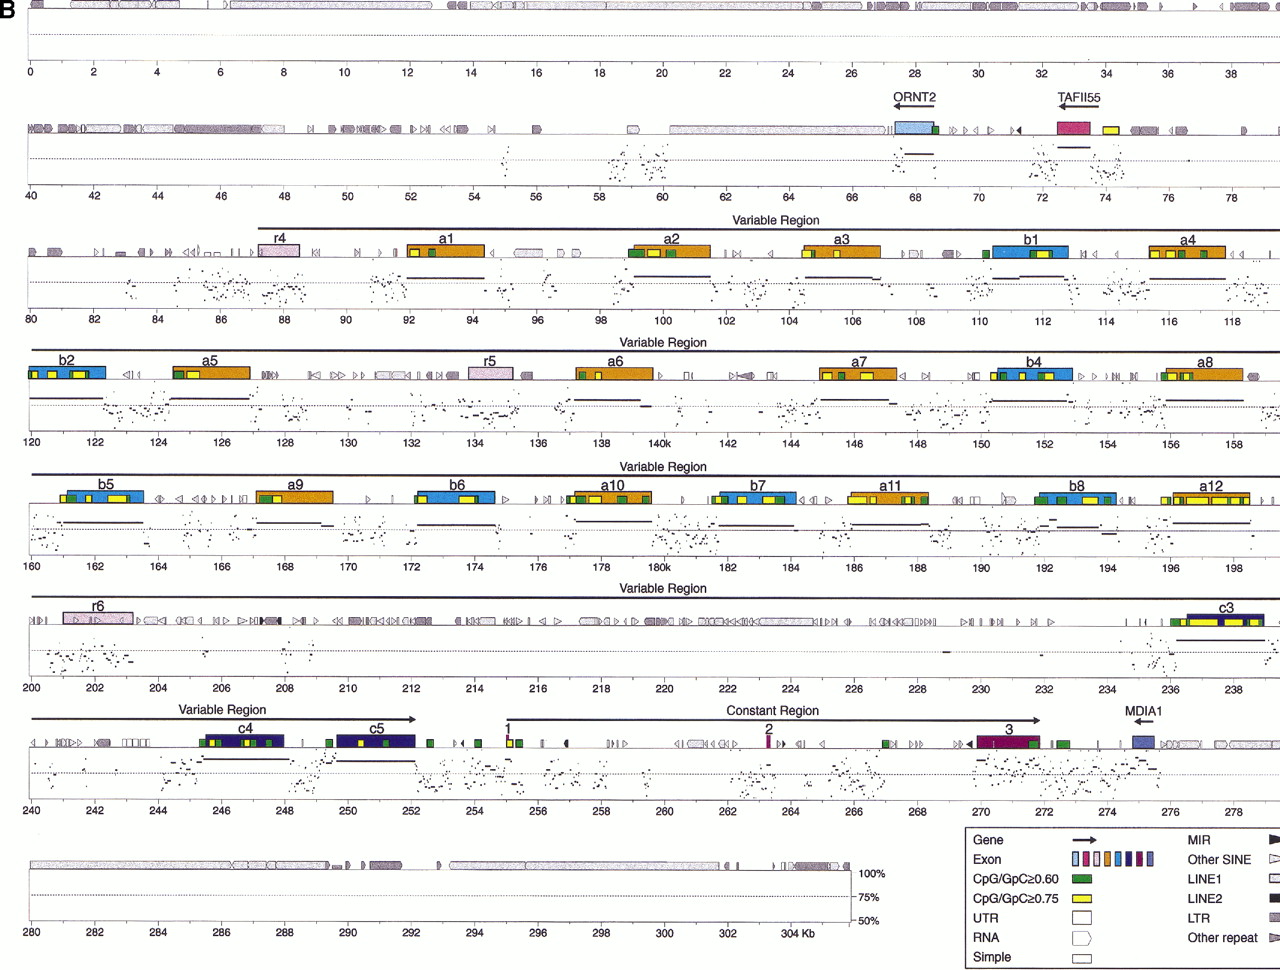
Percent identity plot (PIP) of the Pcdhα (A) and Pcdhγ (B) genomic sequences between mouse and human by using the PipMaker program with the chaining option. The mouse genomic sequences are shown on the x-axis, and the percentage sequence identities (50%–100%) are shown on they-axis. Annotation of the mouse sequences is illustrated at the top of the sequences by solid color boxes. The repeats of mouse sequence are depicted as follows: (black pointed boxes) LINE2s; (light gray pointed boxes) LINE1s; (dark gray pointed boxes) LTRs; (black triangles) MIRs; (light gray triangles) SINEs other than MIRs; (dark gray triangles) other repeats; (white boxes) simple repeats. Short yellow boxes are CpG islands where the ratio of CpG/GpC exceeds 0.75, and short green boxes are CpG islands where the ratio of CpG/GpC is between 0.60 and 0.75. (MDIA1) the last exon of mousediaphanous gene 1.


