
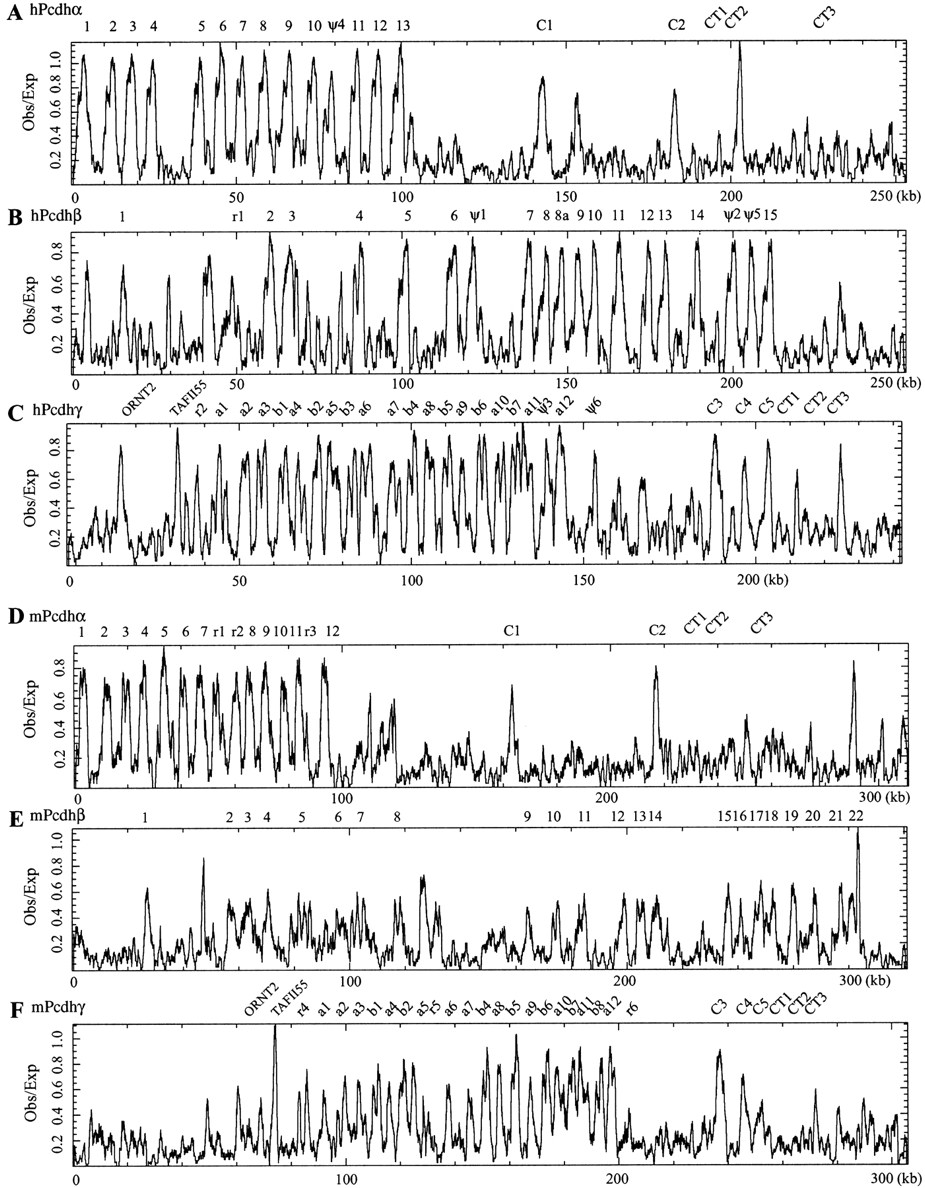
Figure 4.
Distribution of CpG islands in the genomic sequences of human and mouse protocadherin gene clusters. Shown are ratios of observed to expected CpG dinucleotide frequency of a 1000 bp sliding window in the region of human Pcdhα (A), Pcdhβ (B), and Pcdhγ (C) and mousePcdhα (D), Pcdhβ (E), andPcdhγ (F) gene clusters. The peak of ratios correlates with the position of protocadherin variable region exons but not constant region exons. The position of each variable and constant region exon is indicated at the top of each panel. (CT), constant region exon.


