
Figure 2.
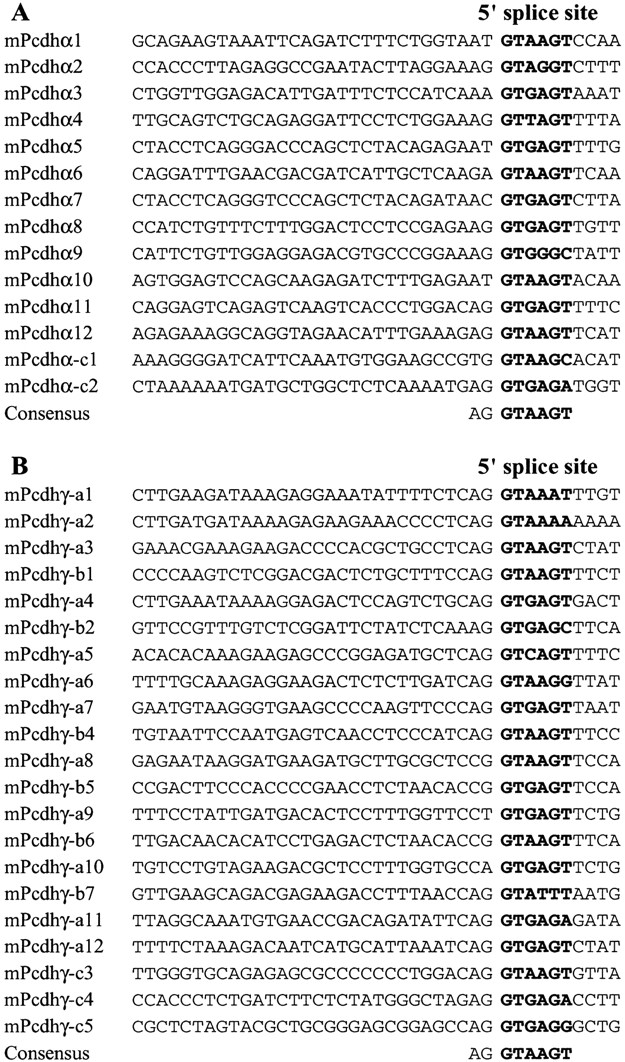
Alignments of variable region 5′ splice sites of mousePcdhα (A) and Pcdhγ (B) gene clusters. The 5′ splice site sequences are shown in bold, with the consensus below each panel.
(Downloading may take up to 30 seconds. If the slide opens in your browser, select File -> Save As to save it.)
Click on image to view larger version.
Alignments of variable region 5′ splice sites of mousePcdhα (A) and Pcdhγ (B) gene clusters. The 5′ splice site sequences are shown in bold, with the consensus below each panel.
 CiteULike
 Delicious
 Digg
Digg Facebook
 Google+
 Reddit
 Twitter
