
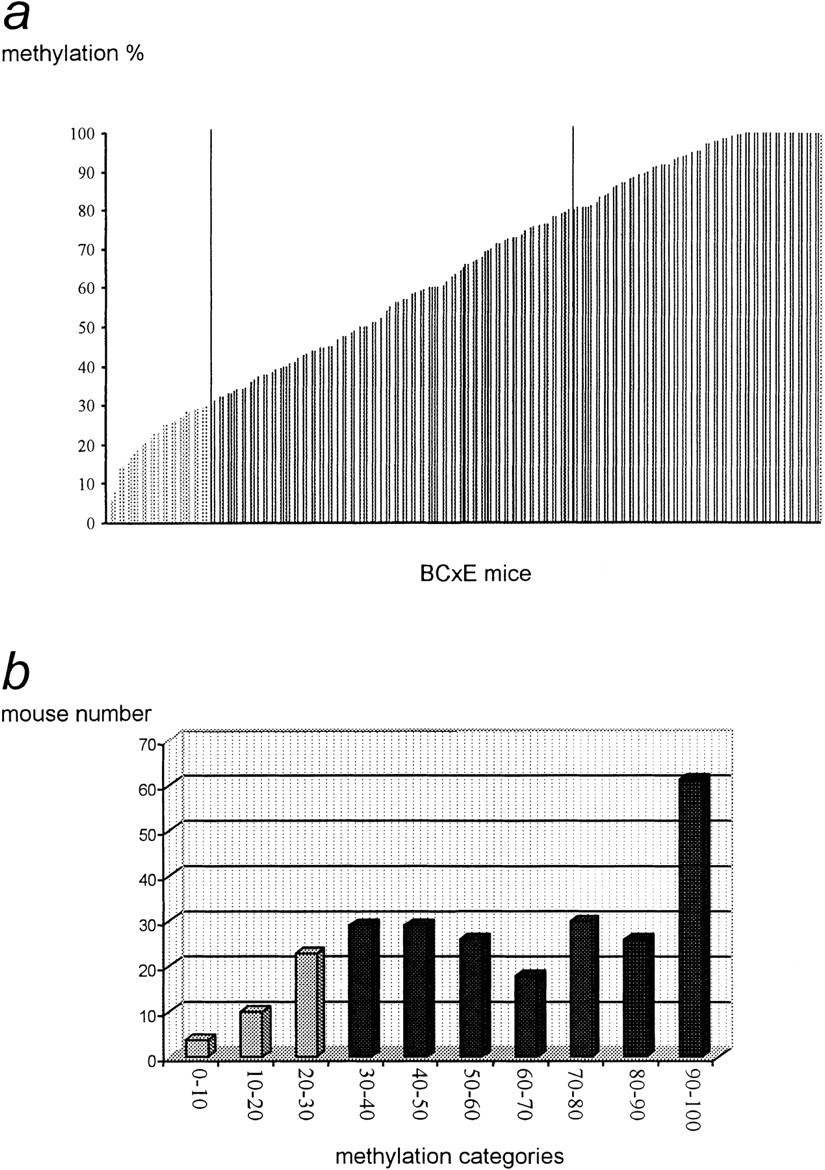
Figure 2.
Distribution of the methylation percentages in 256 BCxE progeny. (a) BCxE mice (x-axis) were ordered according to their transgene methylation percentage (y-axis). (b) Mice have been grouped into categories (x-axis) from 0–10% methylation, 10–20%, etc. The number of mice in each category is shown on the y-axis.


