
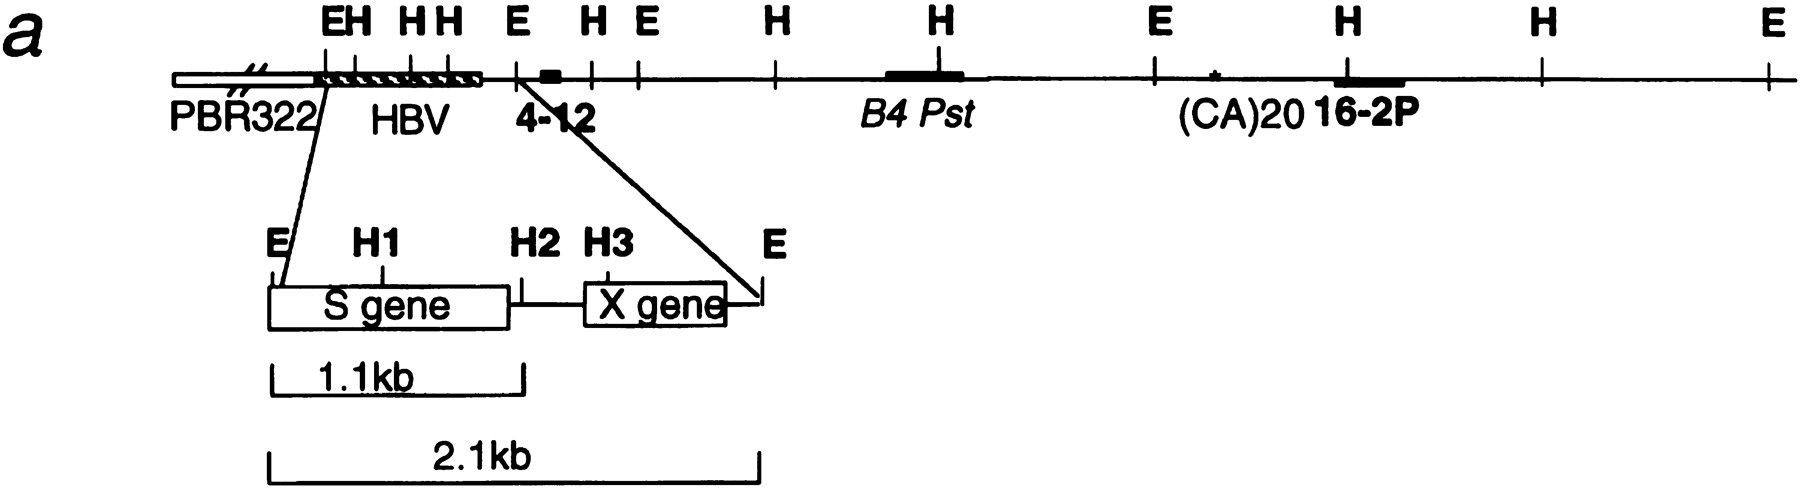
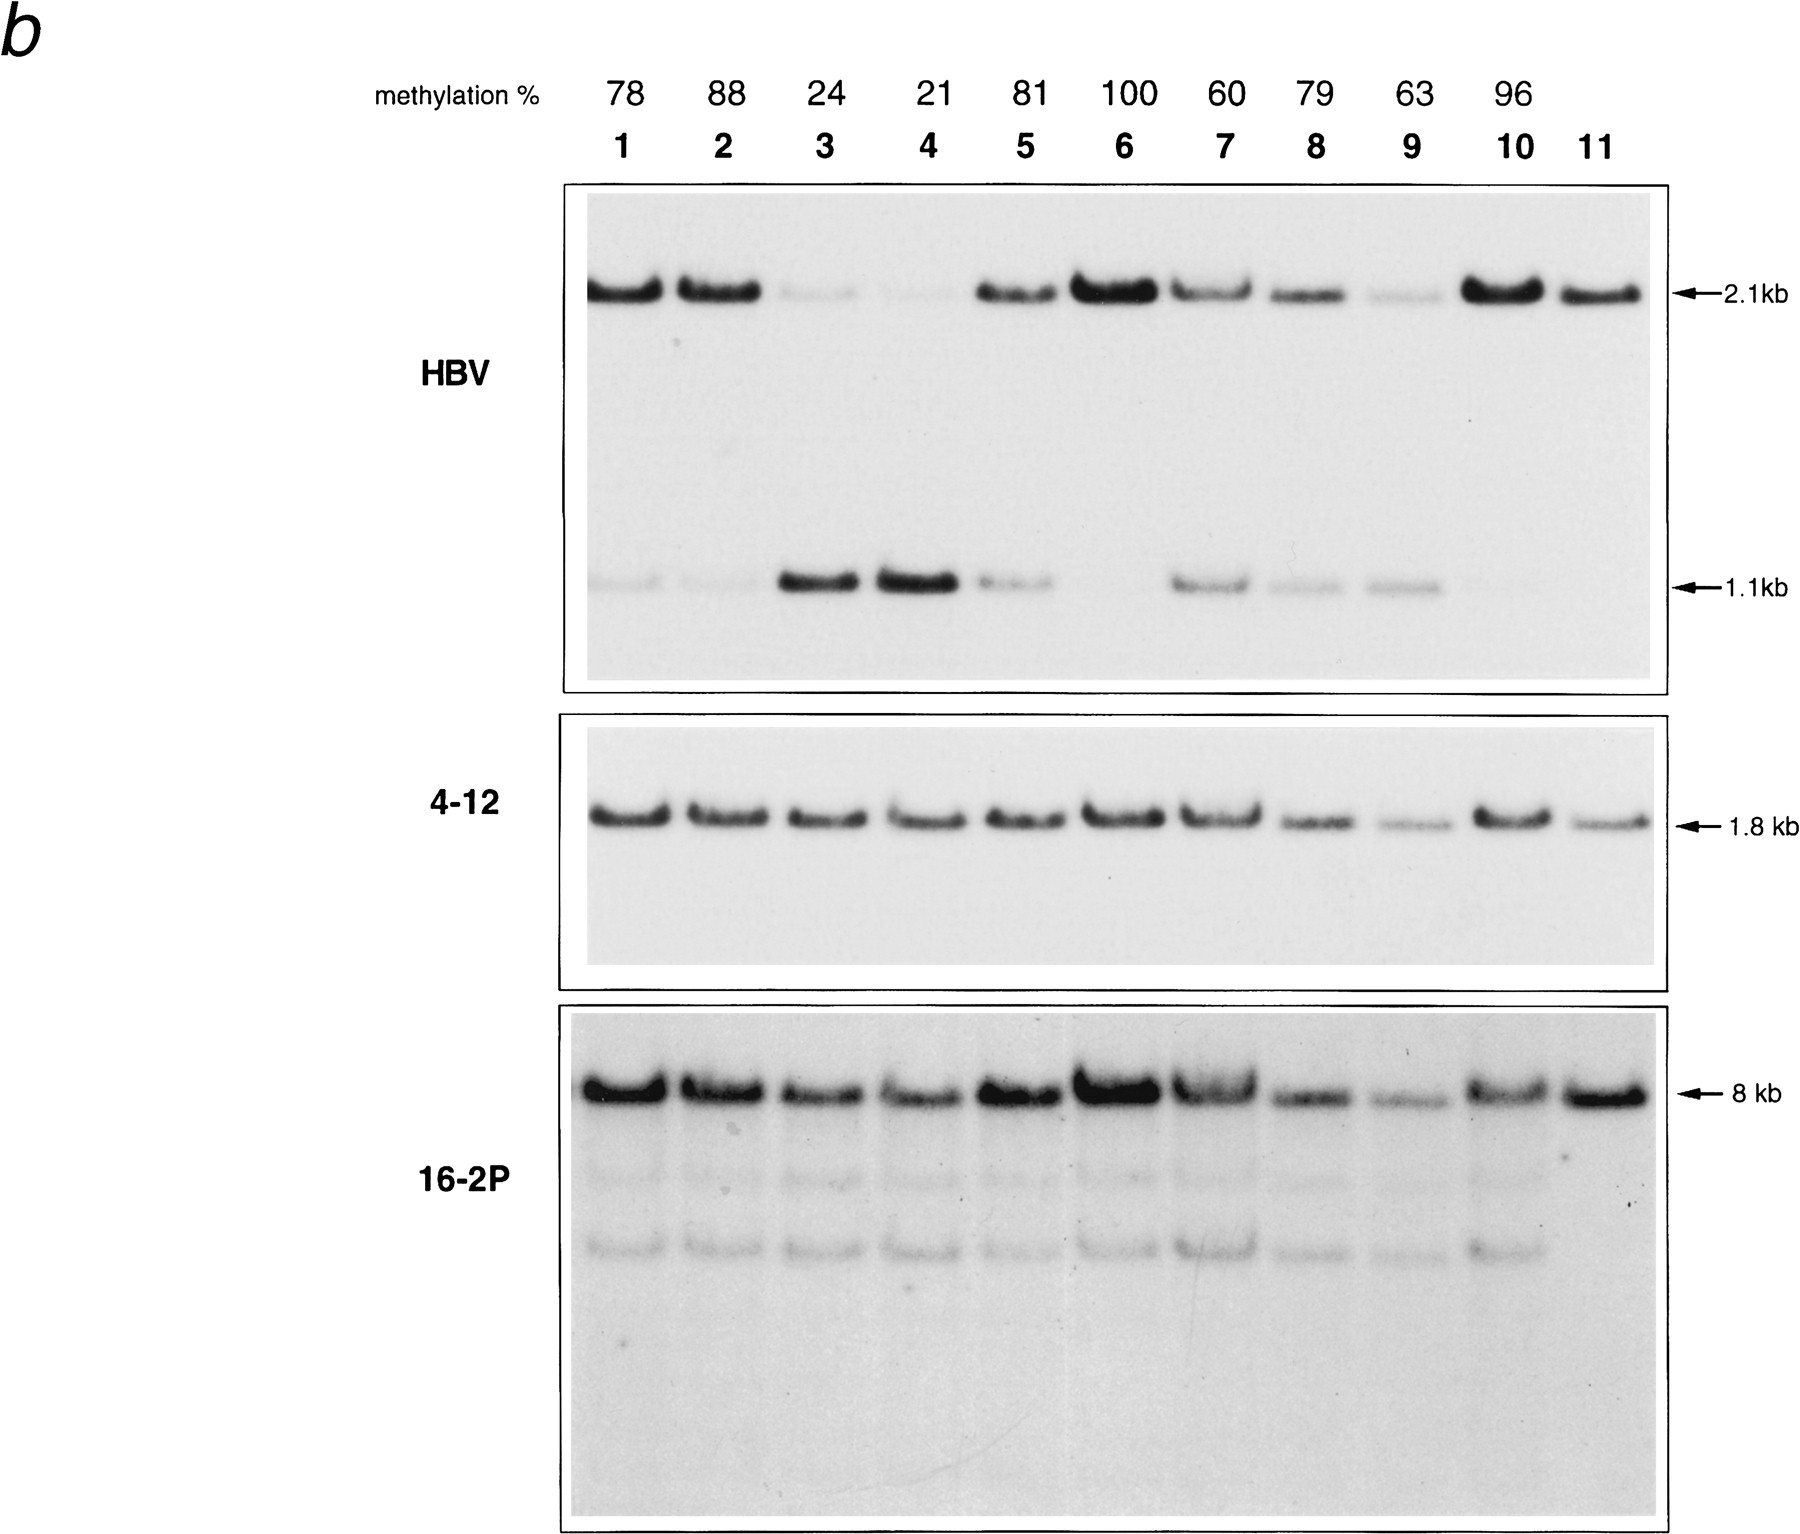
Methylation levels of the transgene and endogenous sequences in 10 BCxE progeny. (a) Genetic organization and restriction map of HBV sequences (striped bar) and of 20-kb mouse genomic sequence flanking the transgene on one side. 4–12, B4 Pst and 16–2P (dark bars) are probes selected for methylation analysis. EcoRI (E) and HpaII (H) sites are shown. (b) Southern blot hybridization profile of genomic DNA digested with EcoRI +HpaII (samples 1–10) or EcoRI (sample 11), and hybridized successively with HBV Eco-Ac, 4–12 and 16–2P probes. The size of relevant restriction fragments are shown on the side. The transgene methylation levels calculated from the HBV hybridization are shown for samples 1–10.


