
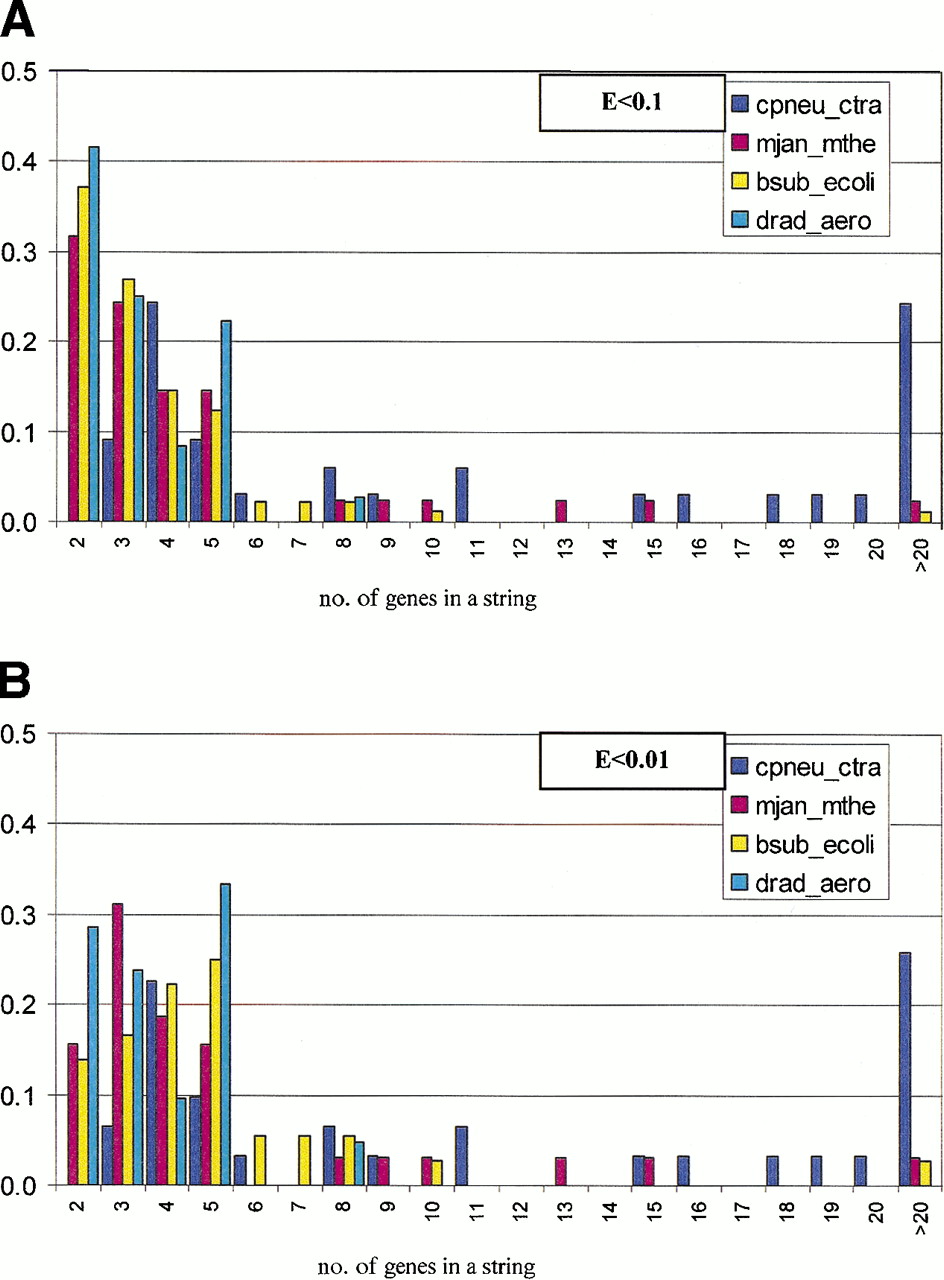
Figure 1.
Length distribution of conserved gene strings in pairs of prokaryotic genomes. The distributions are for information-density-based alignments; the respective E-value cut-offs are indicated in panels A and B. The vertical axis shows the fraction of aligned gene strings for a given genome pair.


