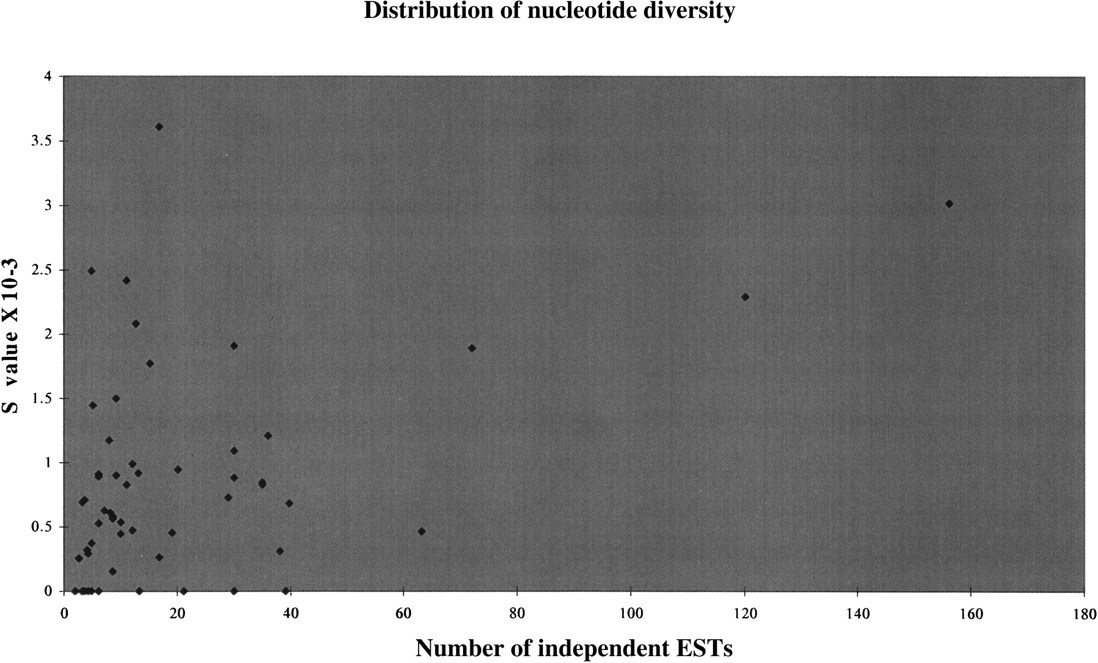
A cSNP Map and Database for Human Chromosome 21

(Downloading may take up to 30 seconds. If the slide opens in your browser, select File -> Save As to save it.)

Click on image to view larger version.

Figure 4.
Figure 4.

The graph shows the distribution of the observed nucleotide diversity against the number of independent ESTs. The correlation coefficient is 0.47. The S value corresponds to the number of cSNPs per nucleotide.

This Article

  1. Genome Res. 11: 300-307

Preprint Server