
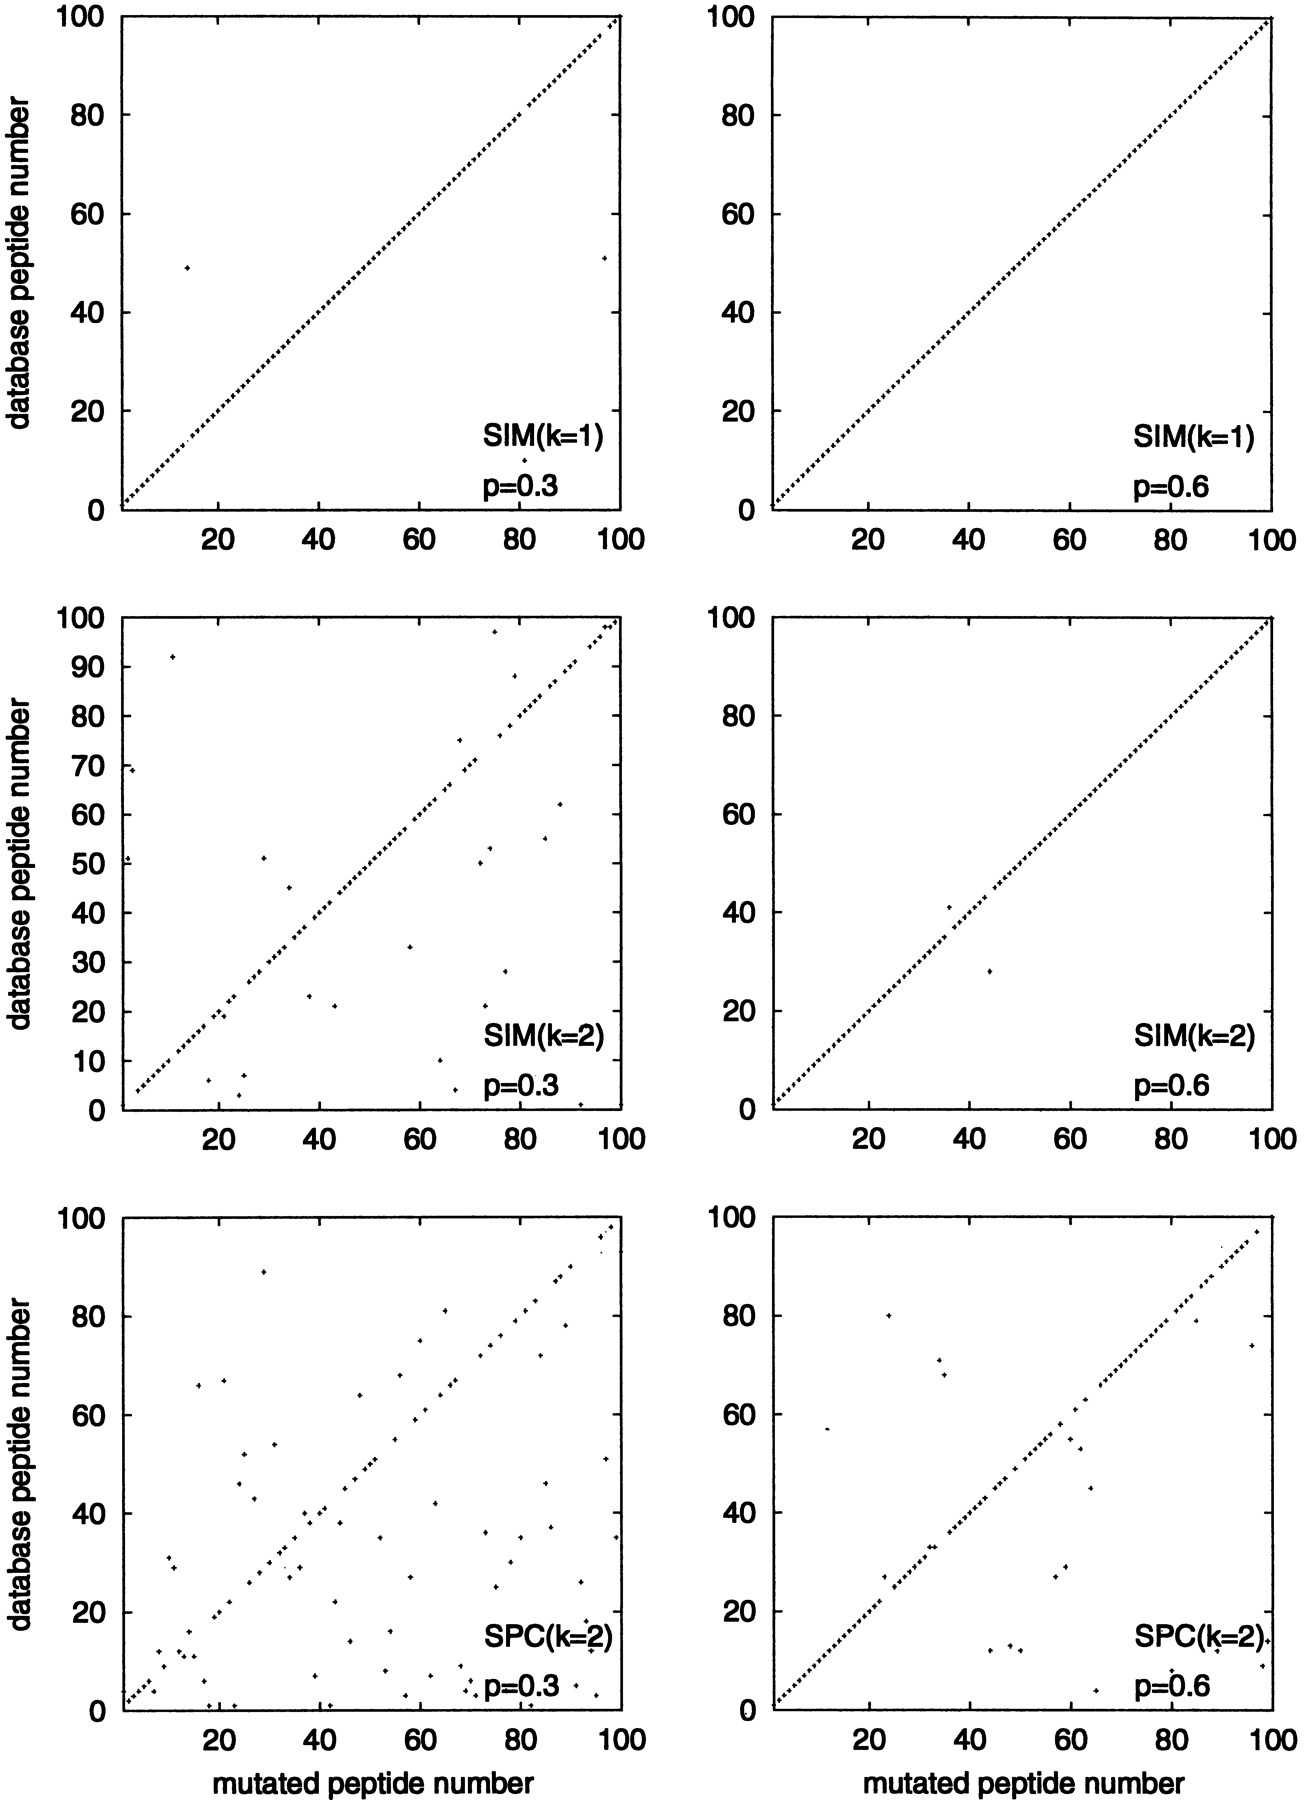
Figure 4.
The matching spectra of mutated peptides with peptides in a small database (100 peptides) at different values of spectral qualityp and number of mutations k. The first two pair of plots describe matching with SIM1 and SIM2similarity scores for k = 1 and k = 2 mutations. The third pair of plots describes matching with the Shared Peaks Count (SPC). Crosses represent best matches, dots represent second-best matches. A cross at position (i, i) on the main diagonal represents the correct matching of spectra i and peptide i.


