
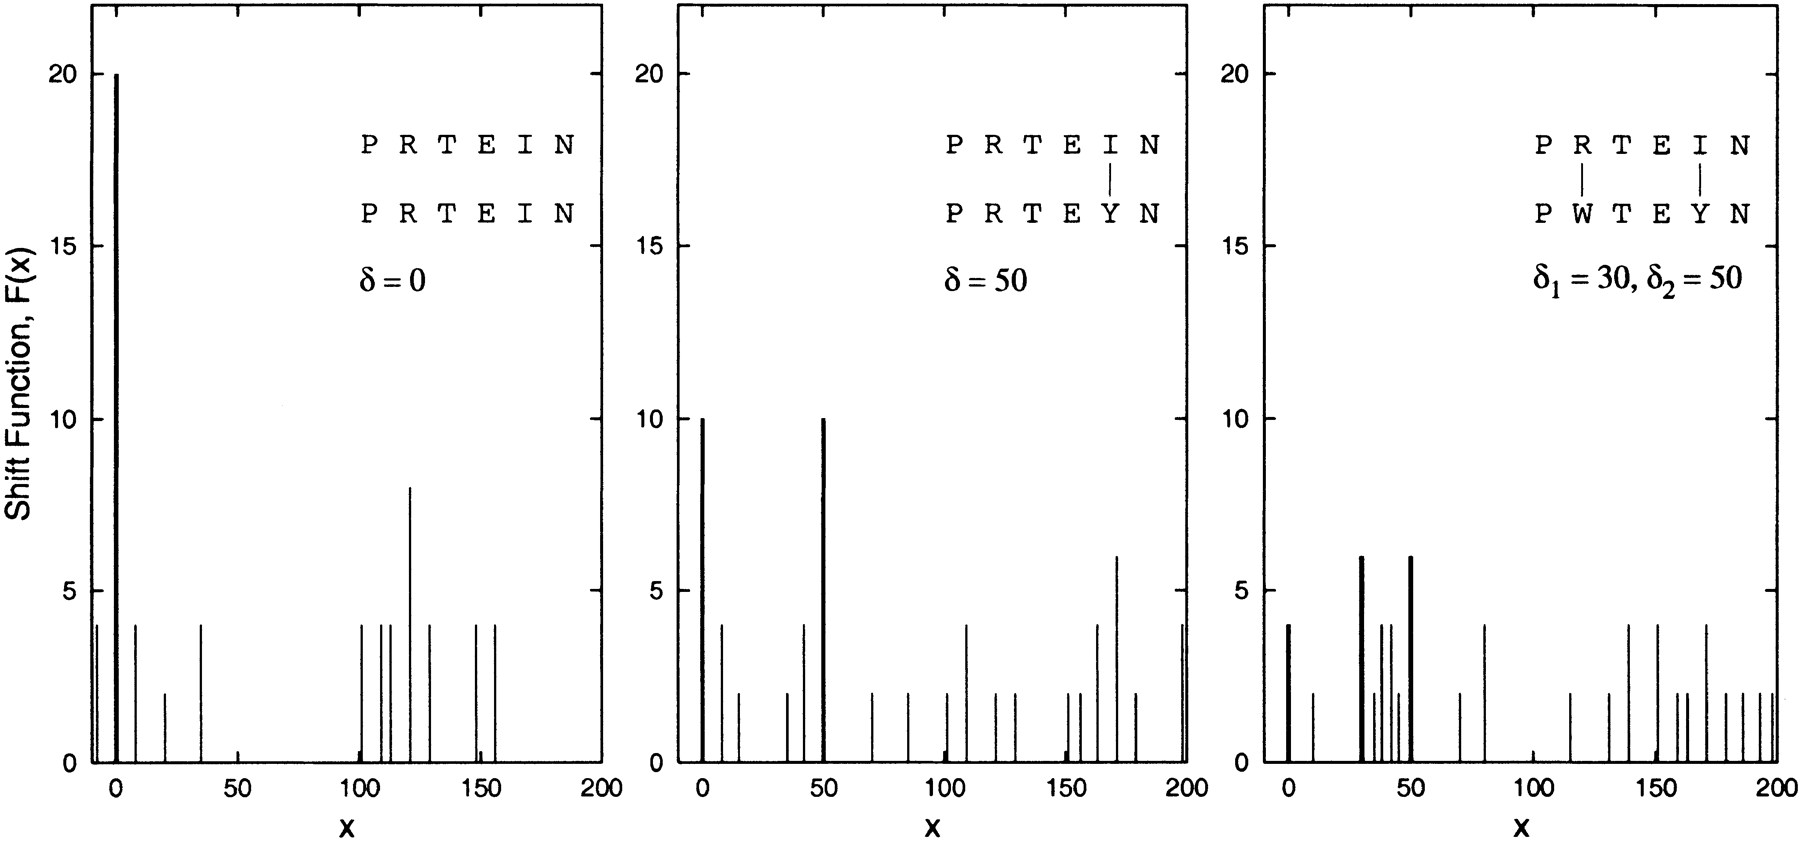
Figure 3.
Shift function F(x) for simulated spectra of pairs of peptides differing by zero, one, and two mutations. The similarity between mutated peptides is captured by multiple peaks in the shift function (indicated by bold bars).


