
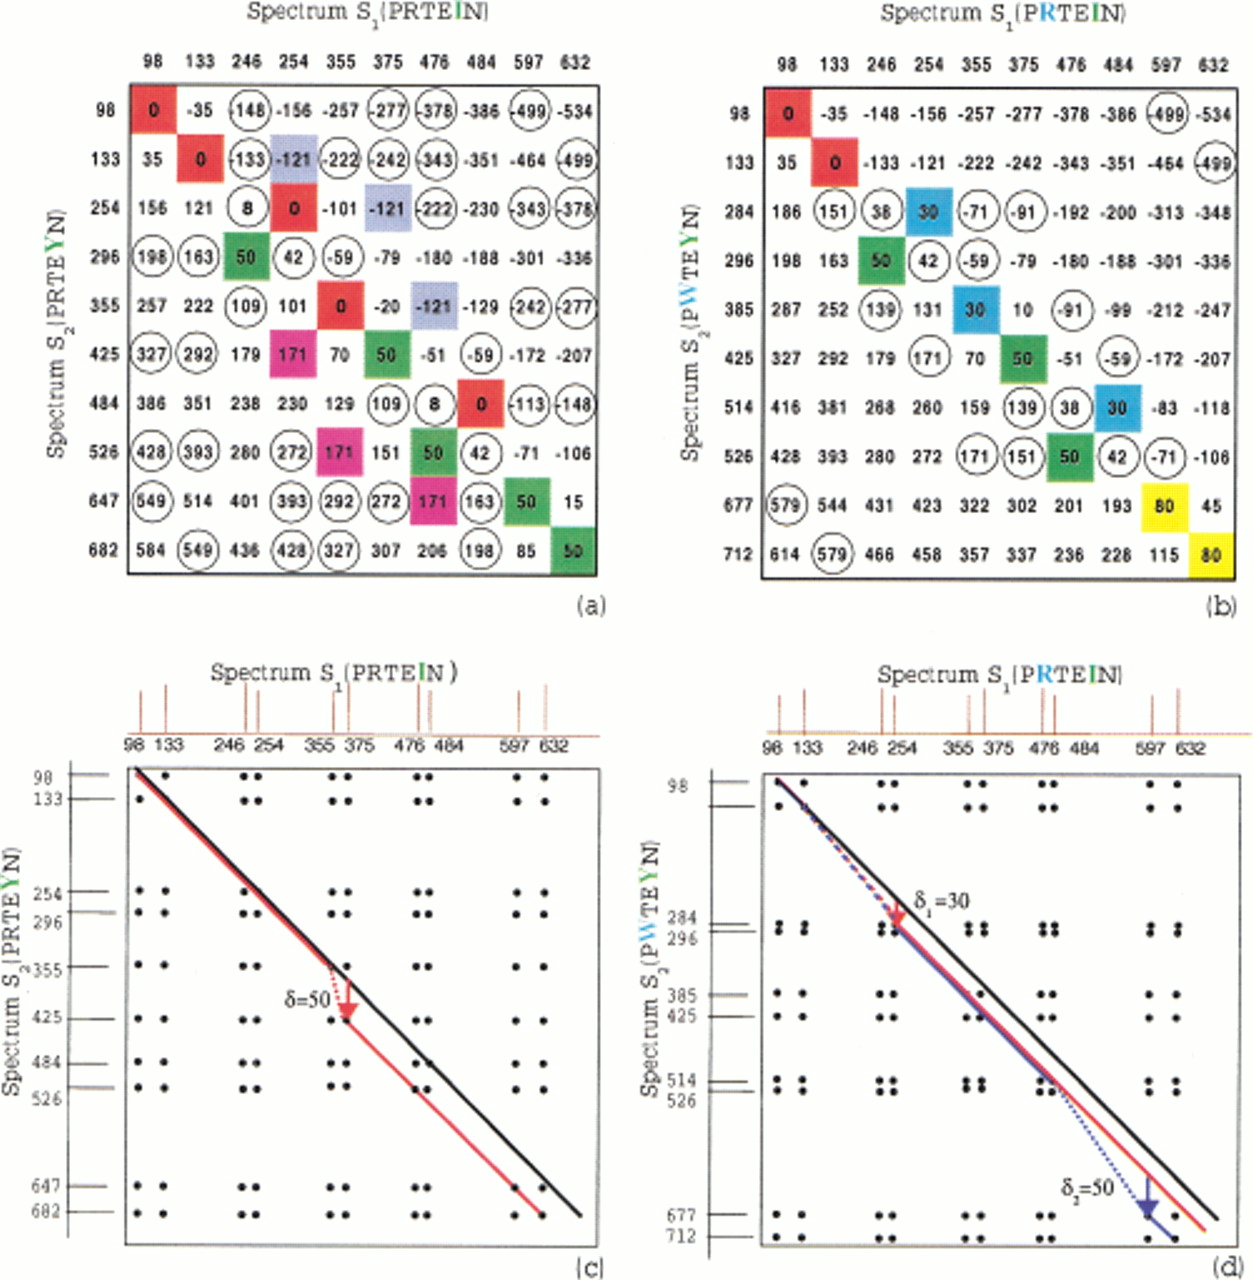
(a) Elements of the spectral convolutionS 2 ⊖ S 1 represented as elements of a difference matrix. (S 1 andS 2 are theoretical spectra of peptides PRTEIN and PRTEYN, correspondingly, differing by a single mutation). The elements with multiplicity >2 are shown in color, and the elements with multiplicity equal to 2 are shown in circles. The high multiplicity element 0 (red) corresponds to shared masses between these spectra, while another high multiplicity element 50 (green) corresponds to the shift of masses by δ = 50 due to mutationI → Y in PRTEIN (the mass of I is 113, and the mass of Y is 163). The SPC takes into account only the red entries in this matrix while the spectral convolution (fork = 1) takes into account both red and green entries, thus providing better peptide identification. (b) Same asa for the case of two mutations in peptide PRTEIN : R → W with δ1 = 30 and I → Y with δ2 = 50 (the mass of R is 156, and the mass of W is 186). Again, SPC takes into account only red entries. (c, d) Spectral alignment. Black lines represent the paths for k = 0 with similarity score (D(0) = 5 in c, andD(0) = 2 in d); red lines represent the paths fork = 1 (D(1) = 8 in c, andD(1) = 5 in d); blue line in d represents the path for k = 2 (D(2) = 7). The Shared Peaks Count reveals only D(0) matching peaks on the main diagonal, while spectral alignment reveals more hidden similarities between spectra and detects the corresponding mutations. Mutations/modifications are detected by jumps between the diagonals, for example,. spectral alignment with k = 1 detects a mutation with amino acid mass difference δ = 50 in c and a mutation with amino acid mass difference δ1 = 30 ind. Alignment with k = 2 detects a second mutation with amino acid mass difference δ2 = 50 ind.


