
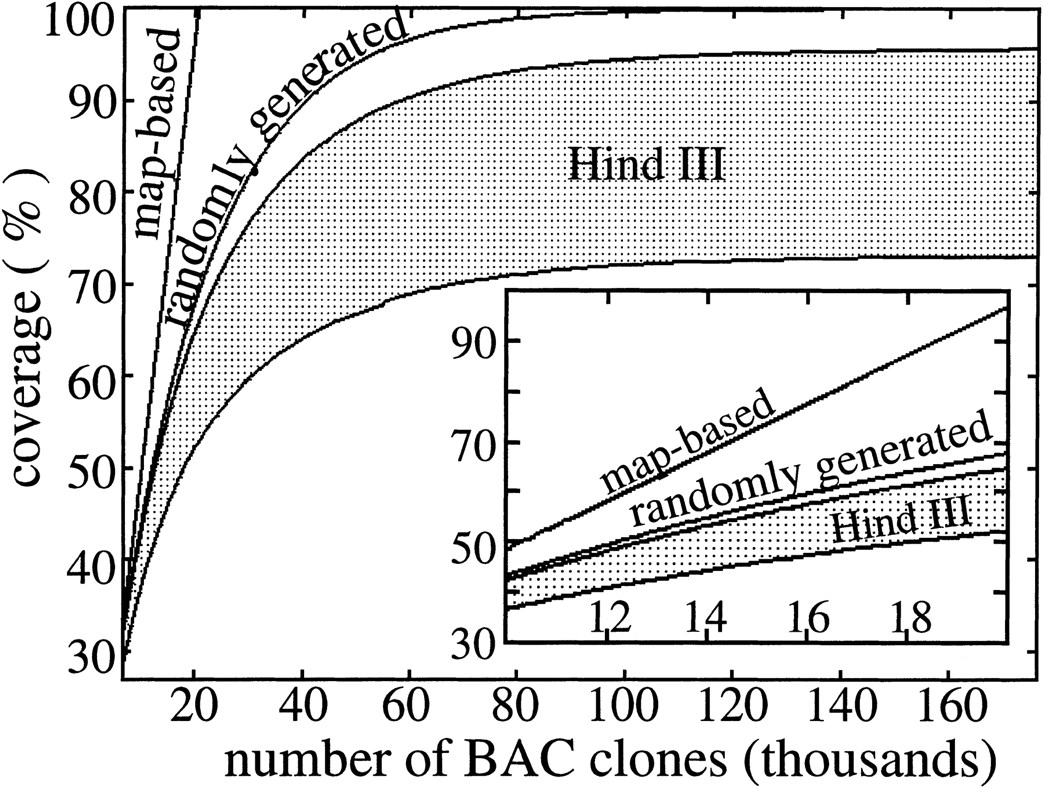
Figure 3.
Predicted coverage up to 176,000 BAC clones (∼10 genome equivalents). The inset shows a magnified view in the 30%–45% range of coverage. HindIII coverage is denoted by the shaded area; the high-bias simulation is the lower of the bounding curves.


