
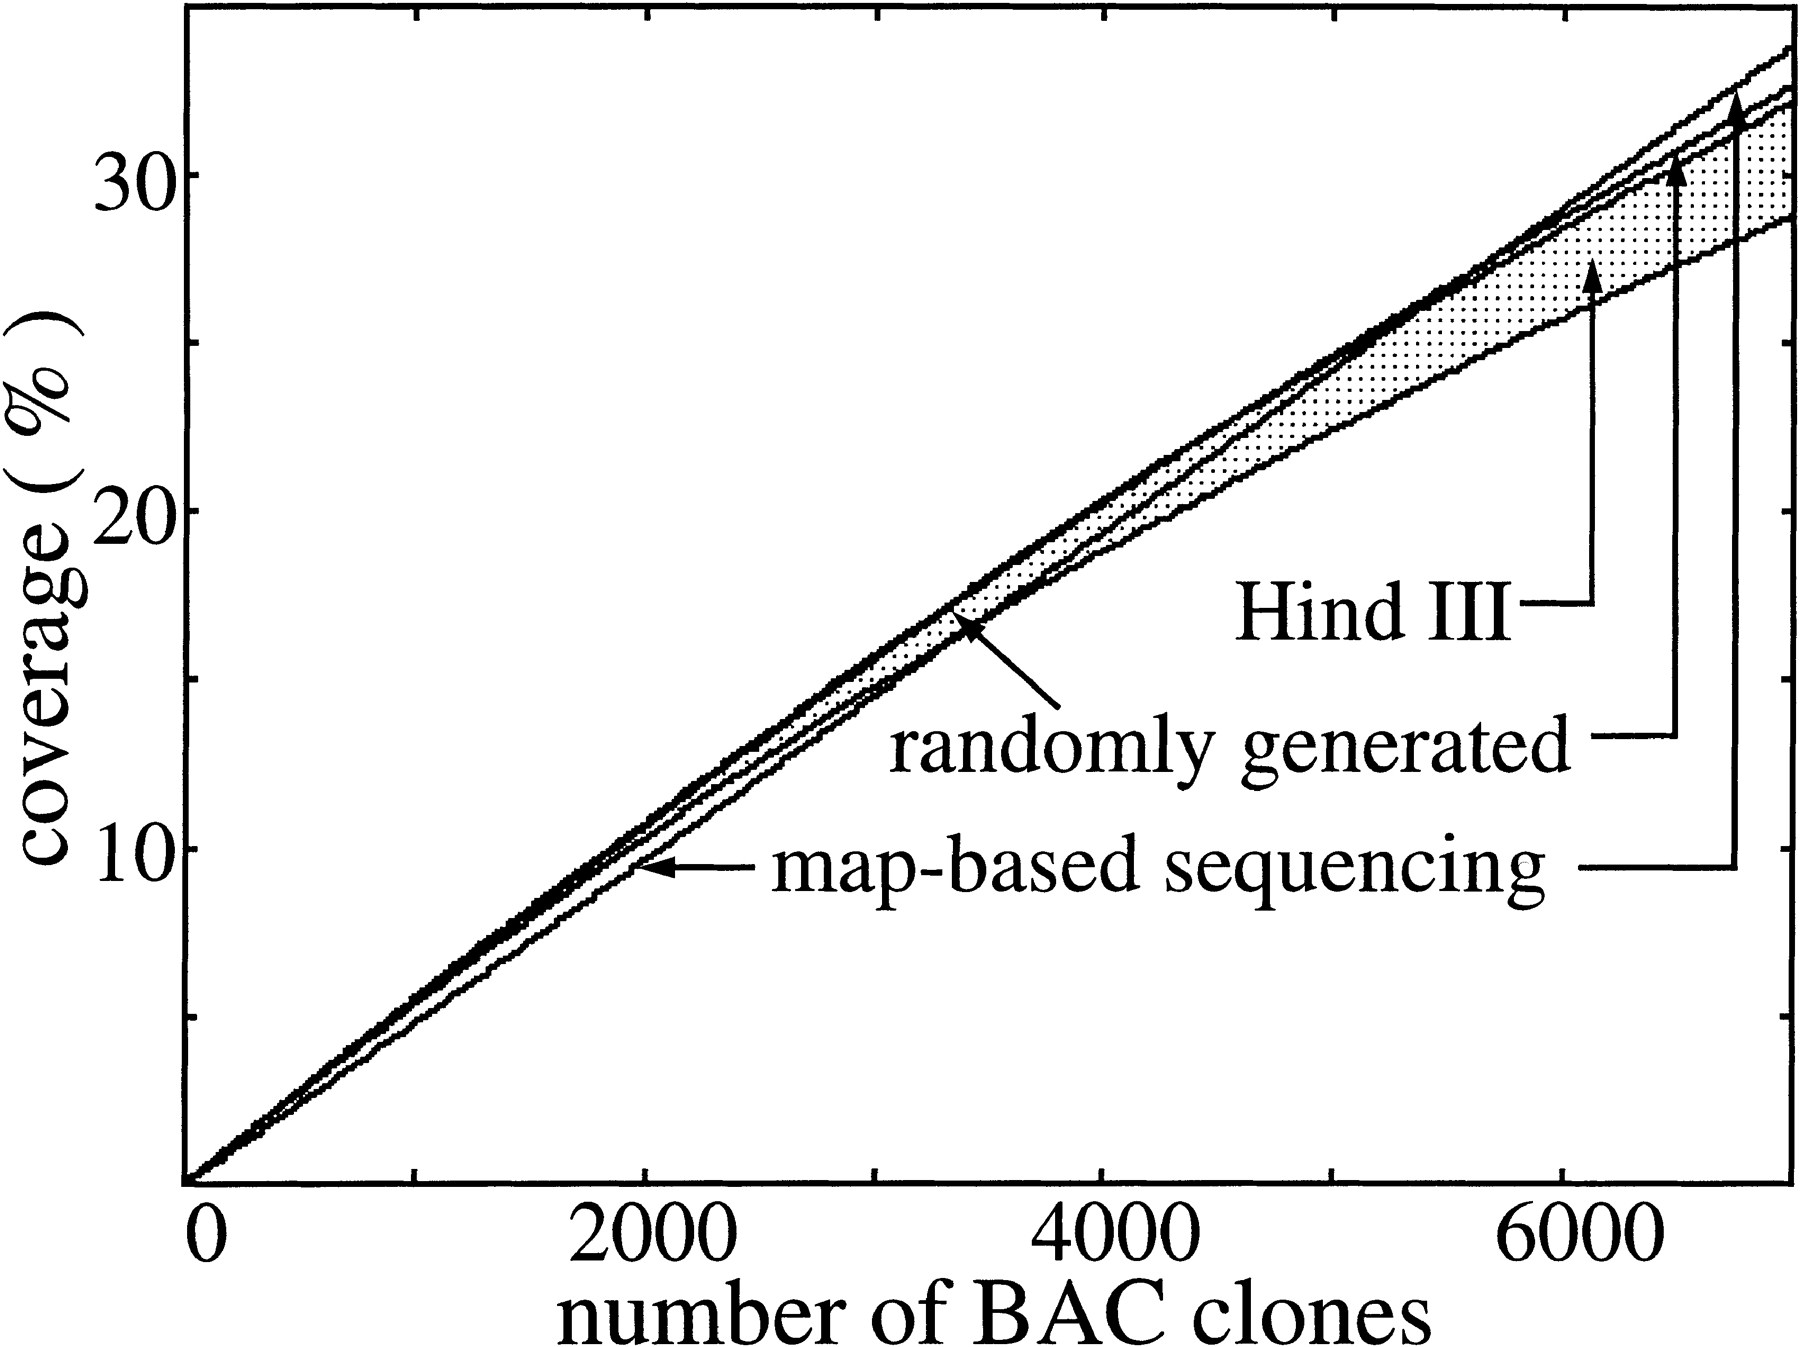
Figure 2.
Effective expected coverage for map-based and randomly selected BAC sequencing for the first 7000 BAC clones. The shaded area denotes theHindIII library; high bias is represented by the lower of the bounding curves.


