
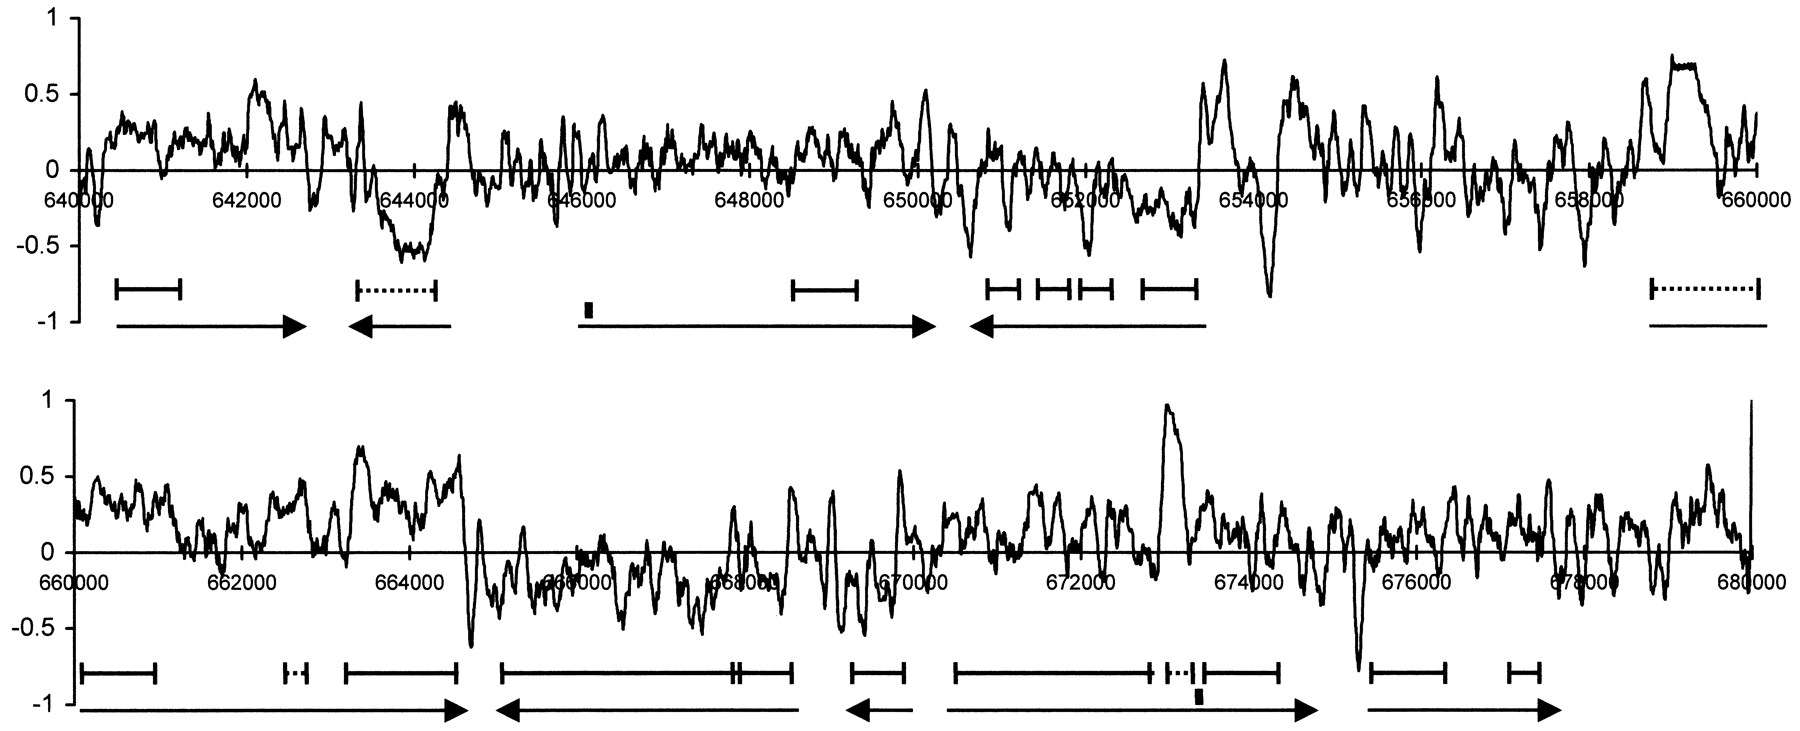
Figure 5.
Skewness (A − T)/(A + T) profile of the 40-kb region ofPlasmodium falciparum chromosome 2 starting at nucleotide 640,000 (Gardner et al. 1998). Arrows indicate rightward- and leftward-transcribed ORFs. Introns are shown as black rectangles. Segments (continuous or dashed) indicate SEG-identified, low-complexity segments (nonrepetitive or repetitive, respectively).


