
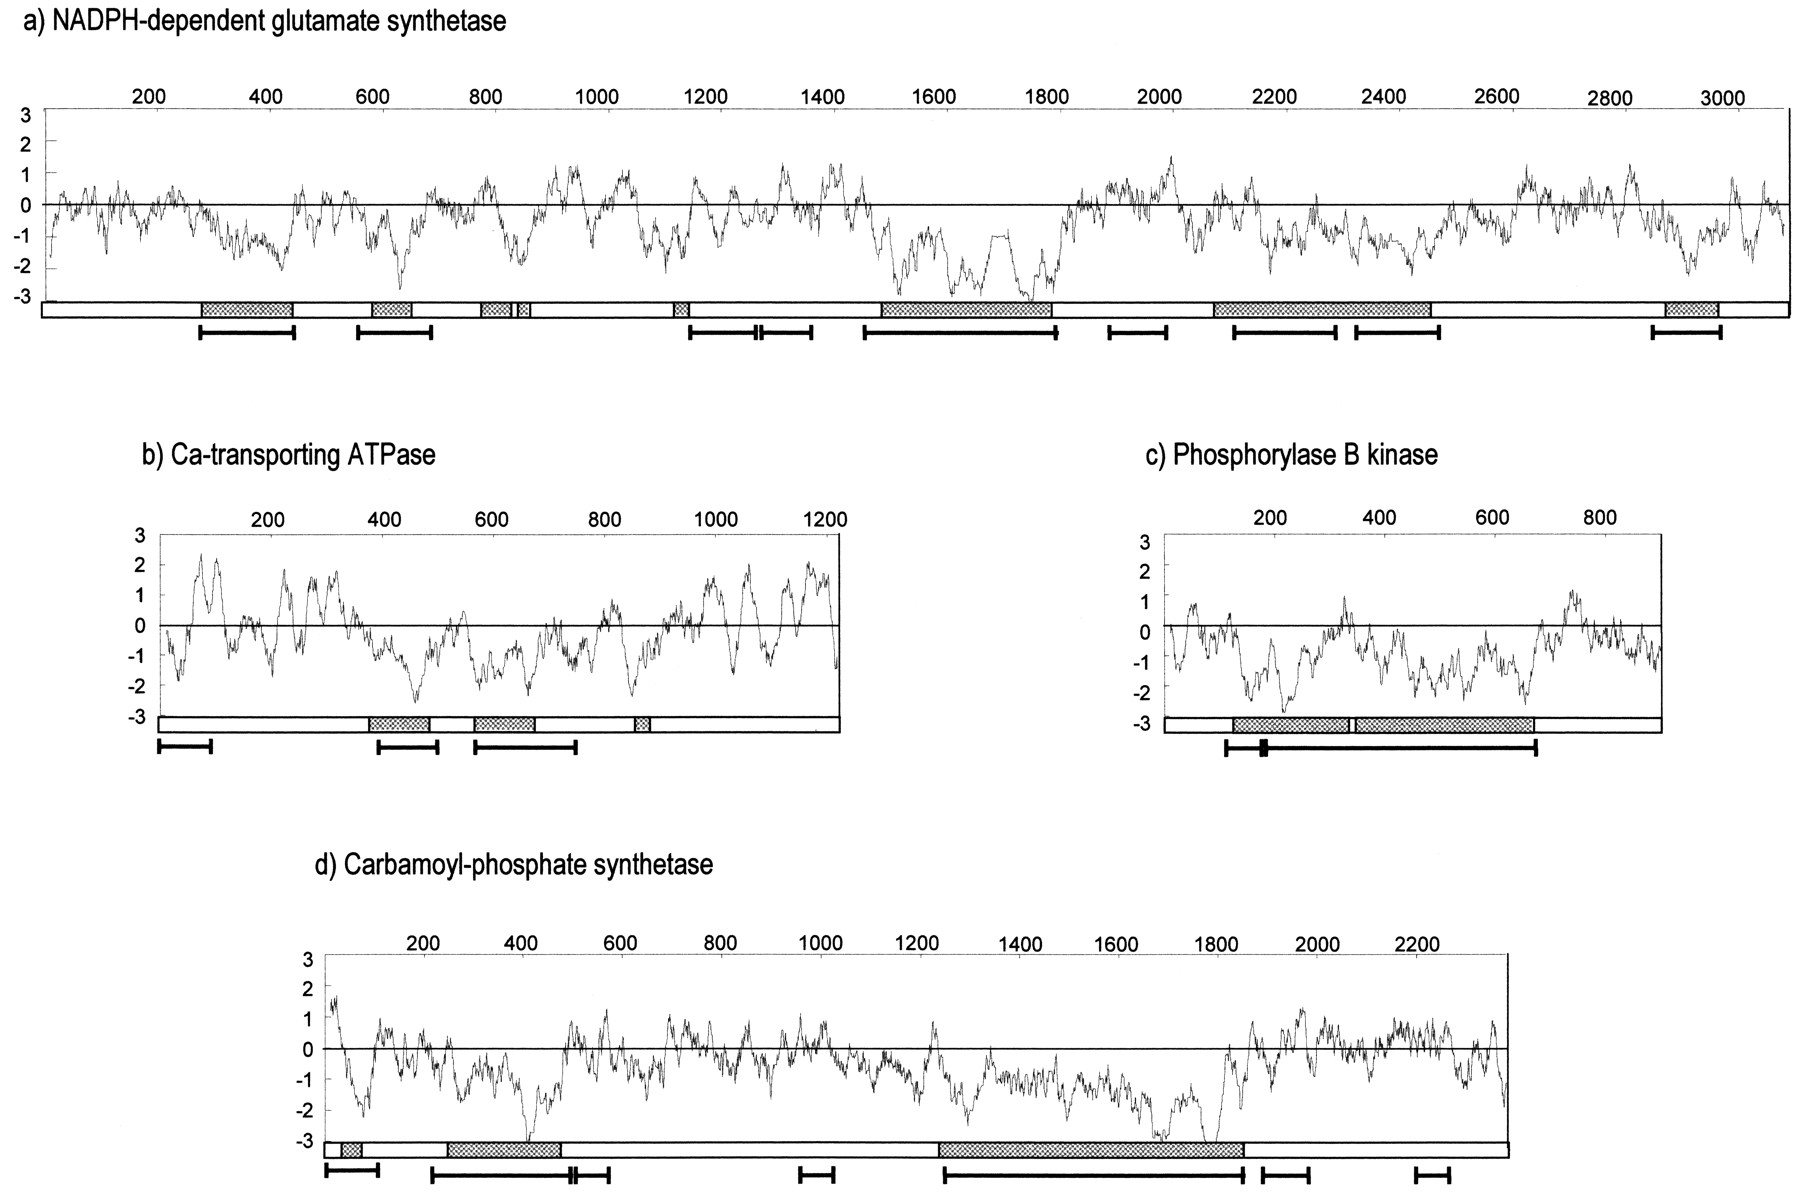
Figure 3.
For each of the indicated proteins (SWALL accession nos. in Methods) a diagram is presented in which insertions (grey boxes) resulting from multialignment procedures are compared with SEG-identified low-complexity regions (segment) and with the hydrophobicity profile of the protein (Kyte and Doolittle 1982).


