
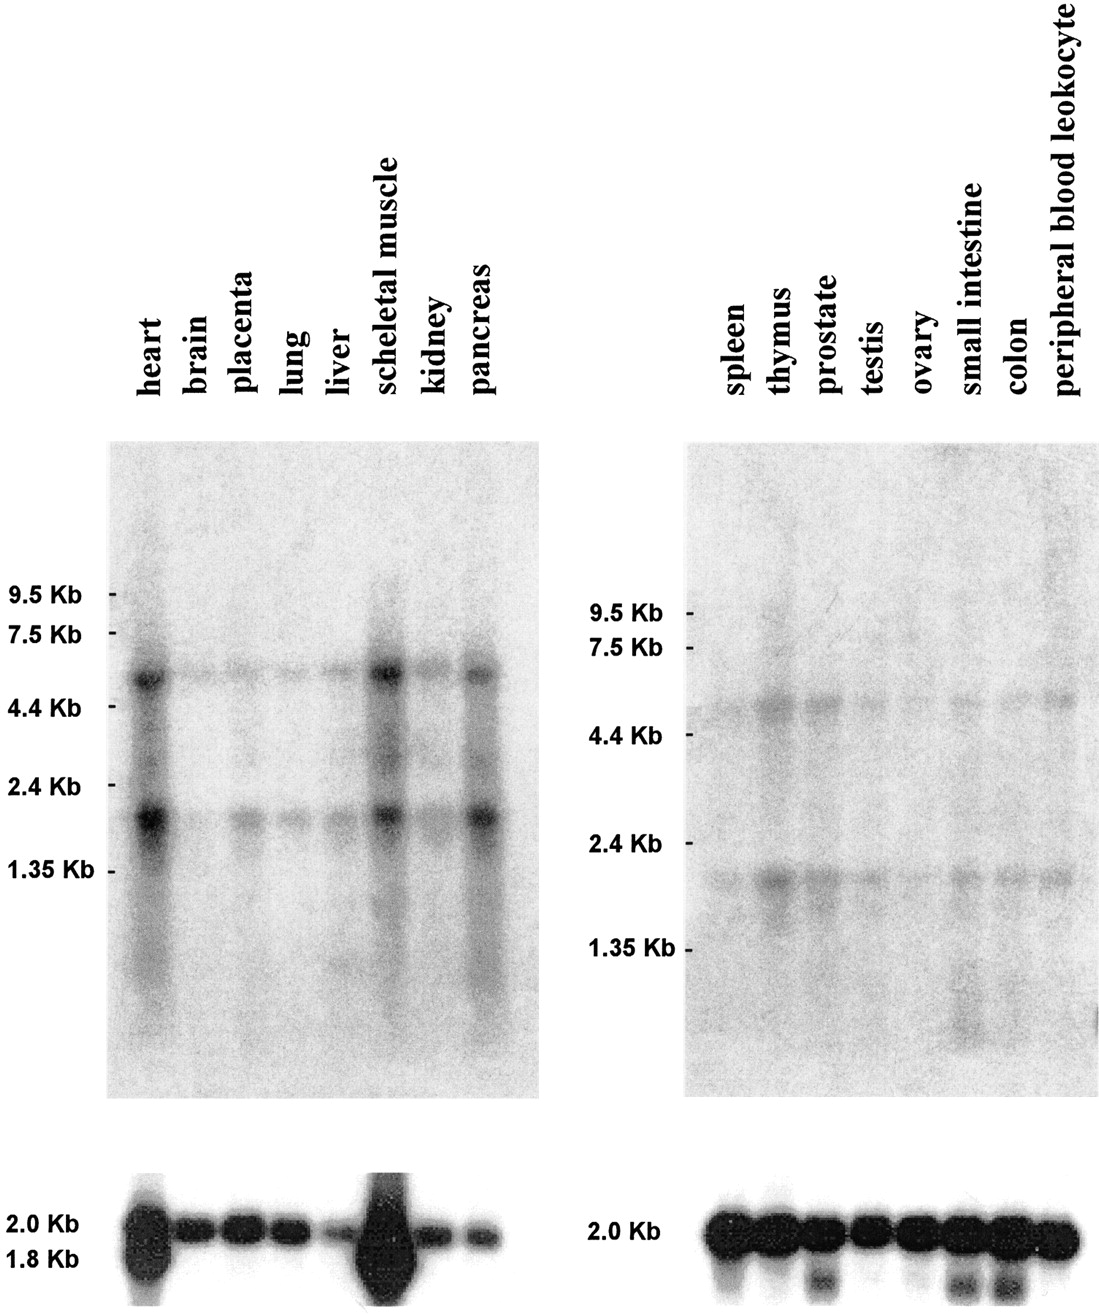
Figure 3.
Gene expression of DHRSXY in human tissues. The bars on the left indicate the position of migration of RNA markers. Reprobing of the same filter with a β-actin probe is shown in the bottom panel.


