
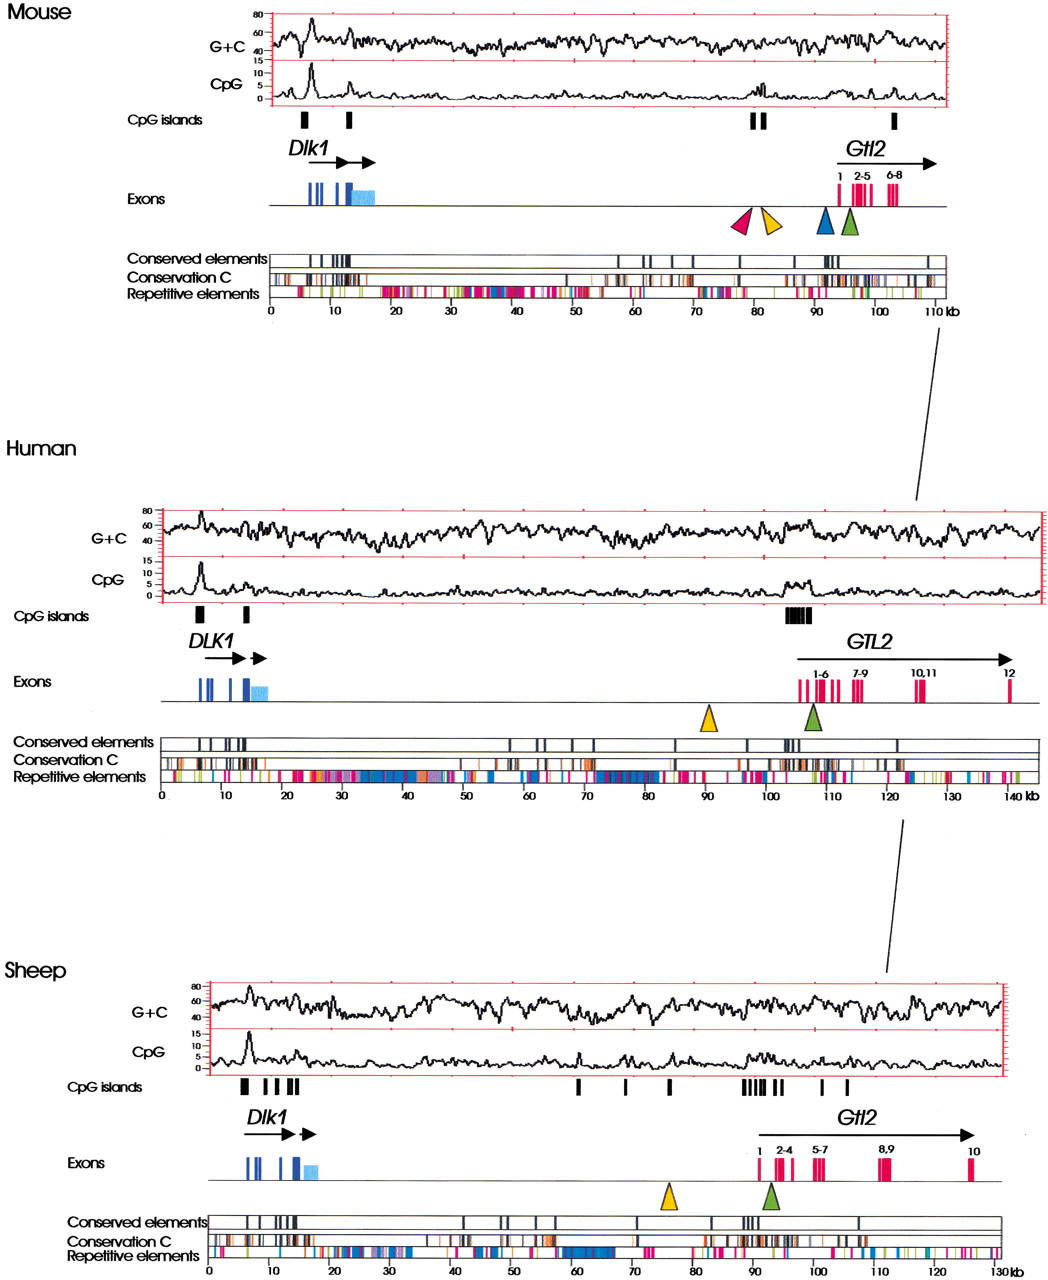
Conserved organization of the Dlk1–Gtl2 regions in mouse, human, and sheep. Above colored panels that describe sequence conservation and distribution of repetitive elements in the analyzed sequences, the structures of Dlk1 (dark blue), the transcript downstream of Dlk1 (light blue), and Gtl2 (red) are indicated by bars that represent exons. Arrows above the depicted exons indicate the orientation of gene transcription. (Conservation C) Conserved elements that are present in the mouse–human, sheep–human, mouse–sheep alignments. Elements that are identical in at least 40% of all positions (>40 bp in length, aligned without gap) are shown in orange, elements that are identical in at least 70% of all positions are shown in black (>40 bp, aligned without gap). (Conserved elements) Elements that are aligned without gaps, identical in at least 70% of all positions, and at least 100 bp long. (Repetitive elements) LINE elements (blue); SINE elements (red); LTR elements (purple); DNA elements (orange); small RNAs (grey); satellites, simple repeats, low complexity DNA (green). (Orange triangles) Conserved CpG-rich repeats; (red triangle) nonconserved CpG-rich repeat; (blue triangle)lacZ integration site; (green triangles) conserved putative CTCF-binding sites. The overall G+C and CpG densities (window size 500 bp, values given as percentages) are presented as plots. CpG islands identified by the CpG plot software (http://www.ebi.ac.uk/index.html) are shown as black bars below the plots.


