
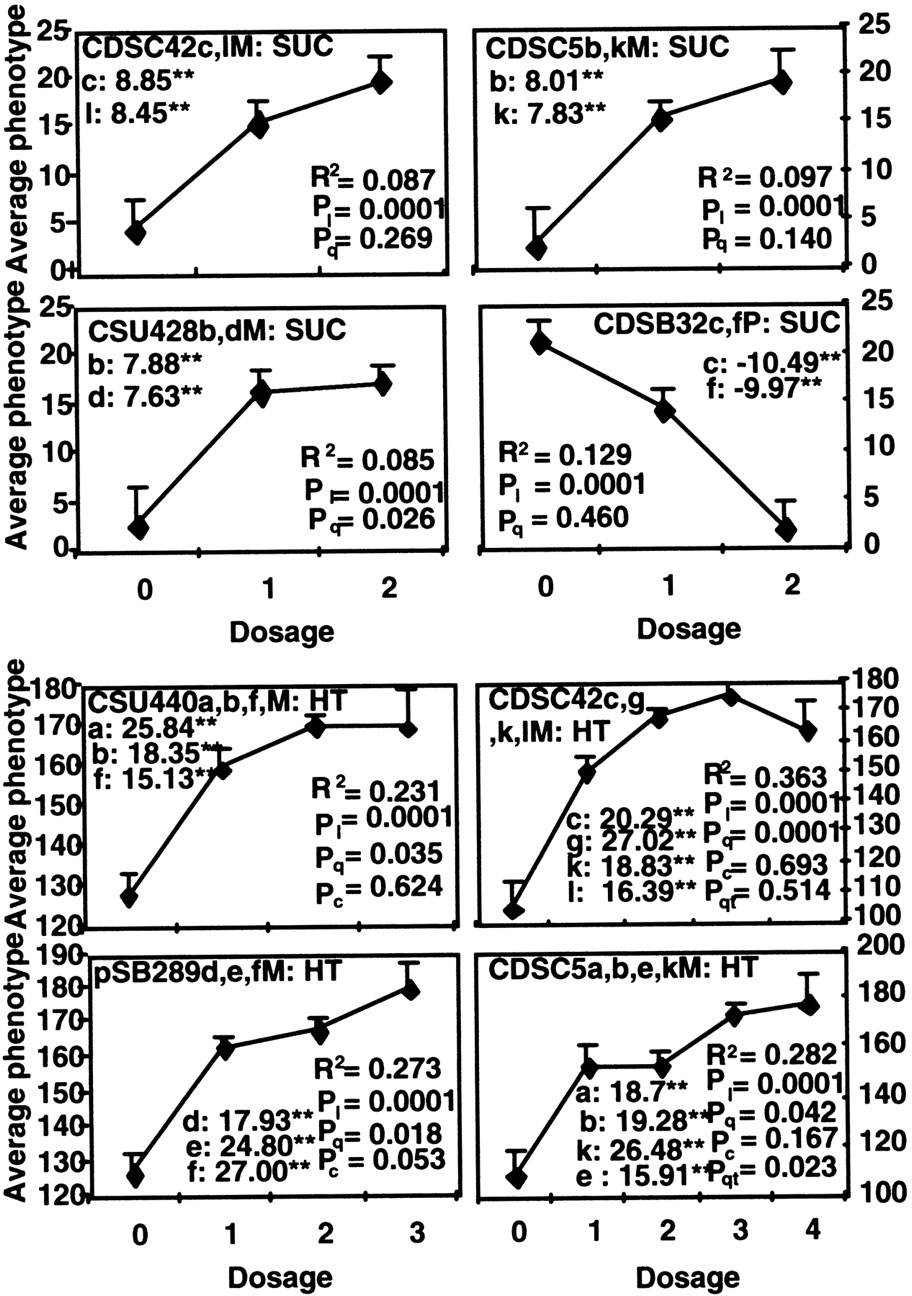
Figure 2.
Dosage effects of QTLs for sugar content and plant height (HT). Lowercase letters after the probe name represent the loci detected by this probe; the capital letter M or P represents parental variety MJ or PIN. Phenotypic effects of allele substitution at each locus are shown next to the locus (letter); the asterisk indicates the significant level at P < 0.01. Pl, Pq, Pc, and Pqt are the probabilities that linear, quadratic, cubic, and quartic components of the dosage curve are equal to zero.


