
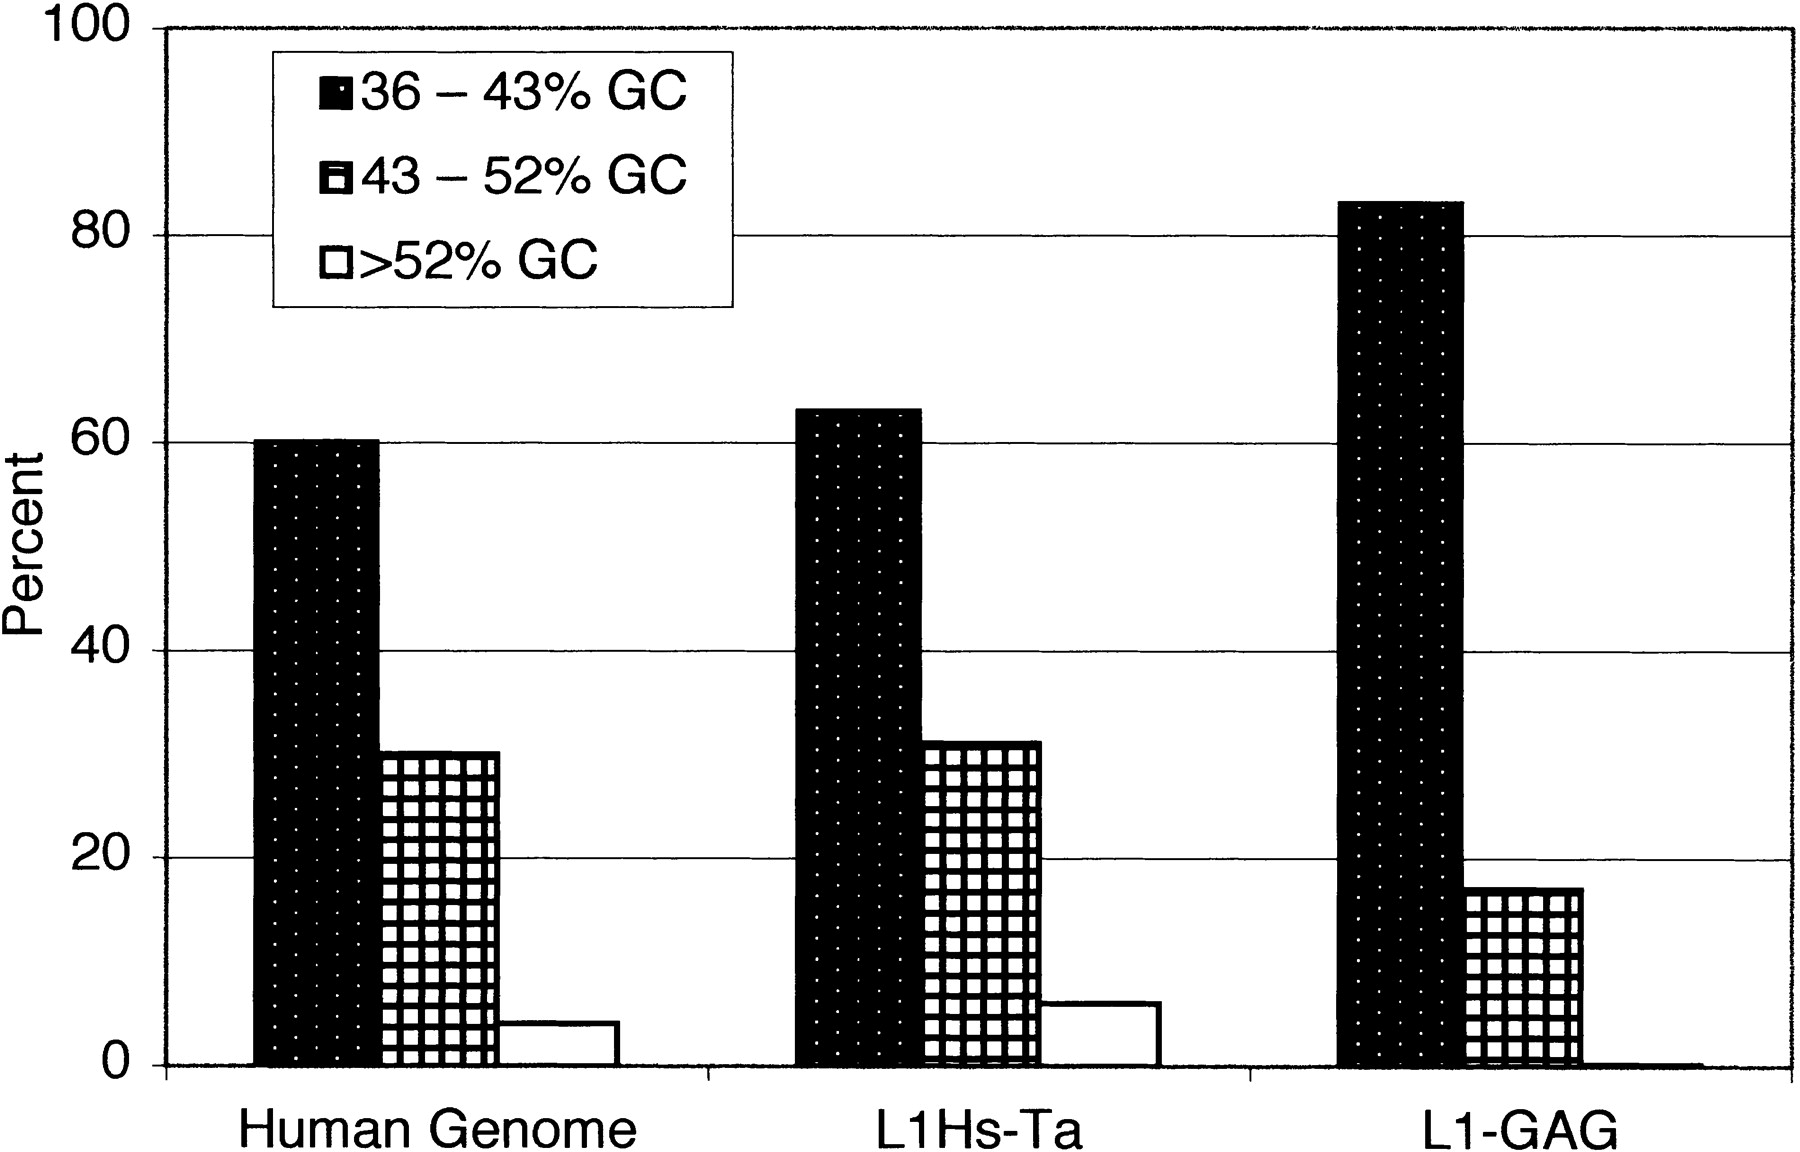
Figure 5.
Distribution of L1 insertions in genomic DNA of different GC content. The GC content of the 3′ flanks of L1 insertions was calculated starting 150 bp after the poly(A) addition signal. Each insertion was assigned to bins of either 36%–43% GC (stippled), 43%–52% GC (checkered), or >52% GC (open box).


