
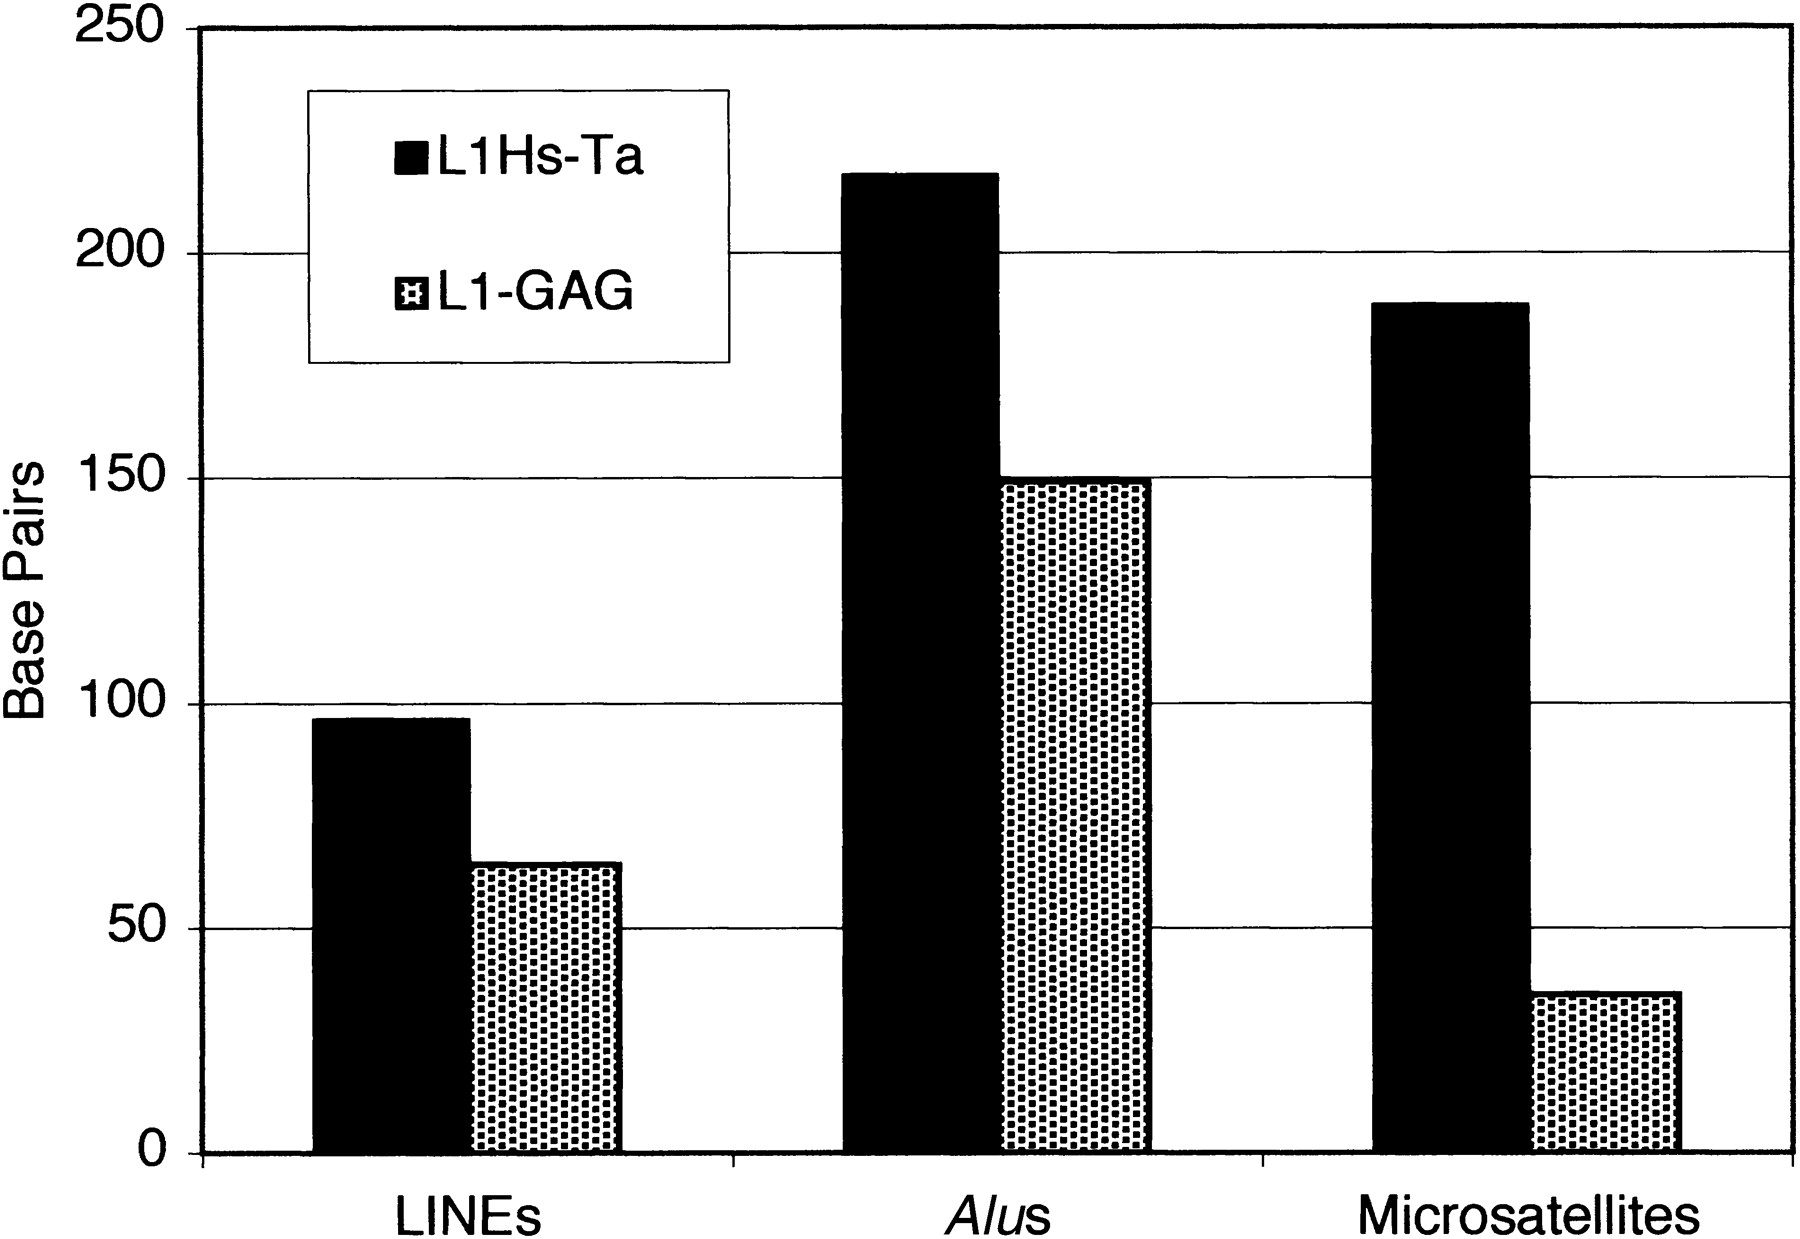
Figure 4.
Distance from the poly(A) addition signal to the nearest repeat sequence in 3′-flanking DNA. The distance was calculated in bp from the end of the poly(A) addition signal. L1Hs-Ta insertions are represented in the black bars; L1-GAG insertions are represented in the stippled bars.


