

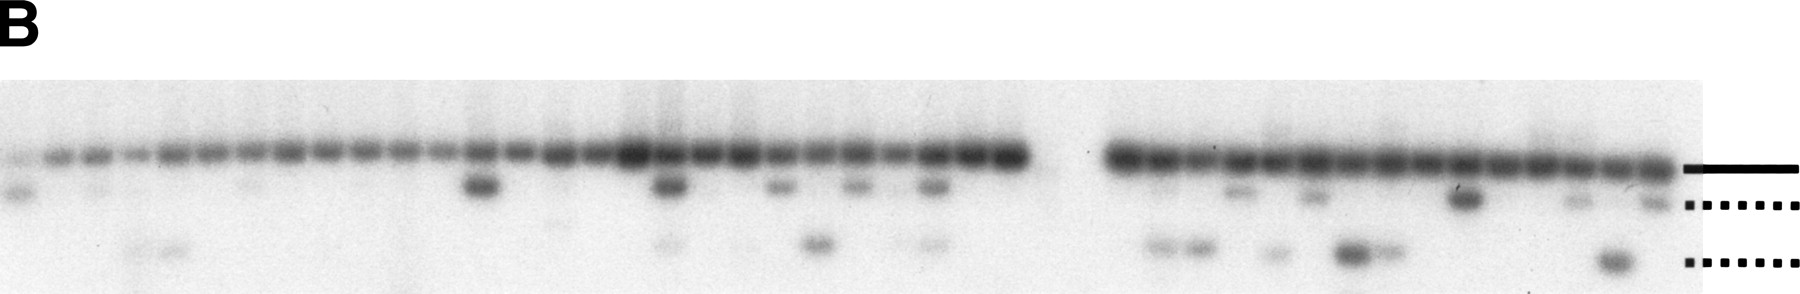
Figure 1.
L1 display, method, and results. (A) L1 display. A L1Hs-Ta insertion (rectangle) is depicted surrounded by flanking DNA (solid lines). The broken lines represent the products of two rounds of PCR amplifications. The arrows below indicate the relative positions and orientations of the primers. (B) L1 display results. A typical L1 display experiment performed with a single decamer on genomic DNA from 42 individuals is shown. One fixed (solid line) and two polymorphic (broken lines) L1Hs-Ta insertions can be seen.


