
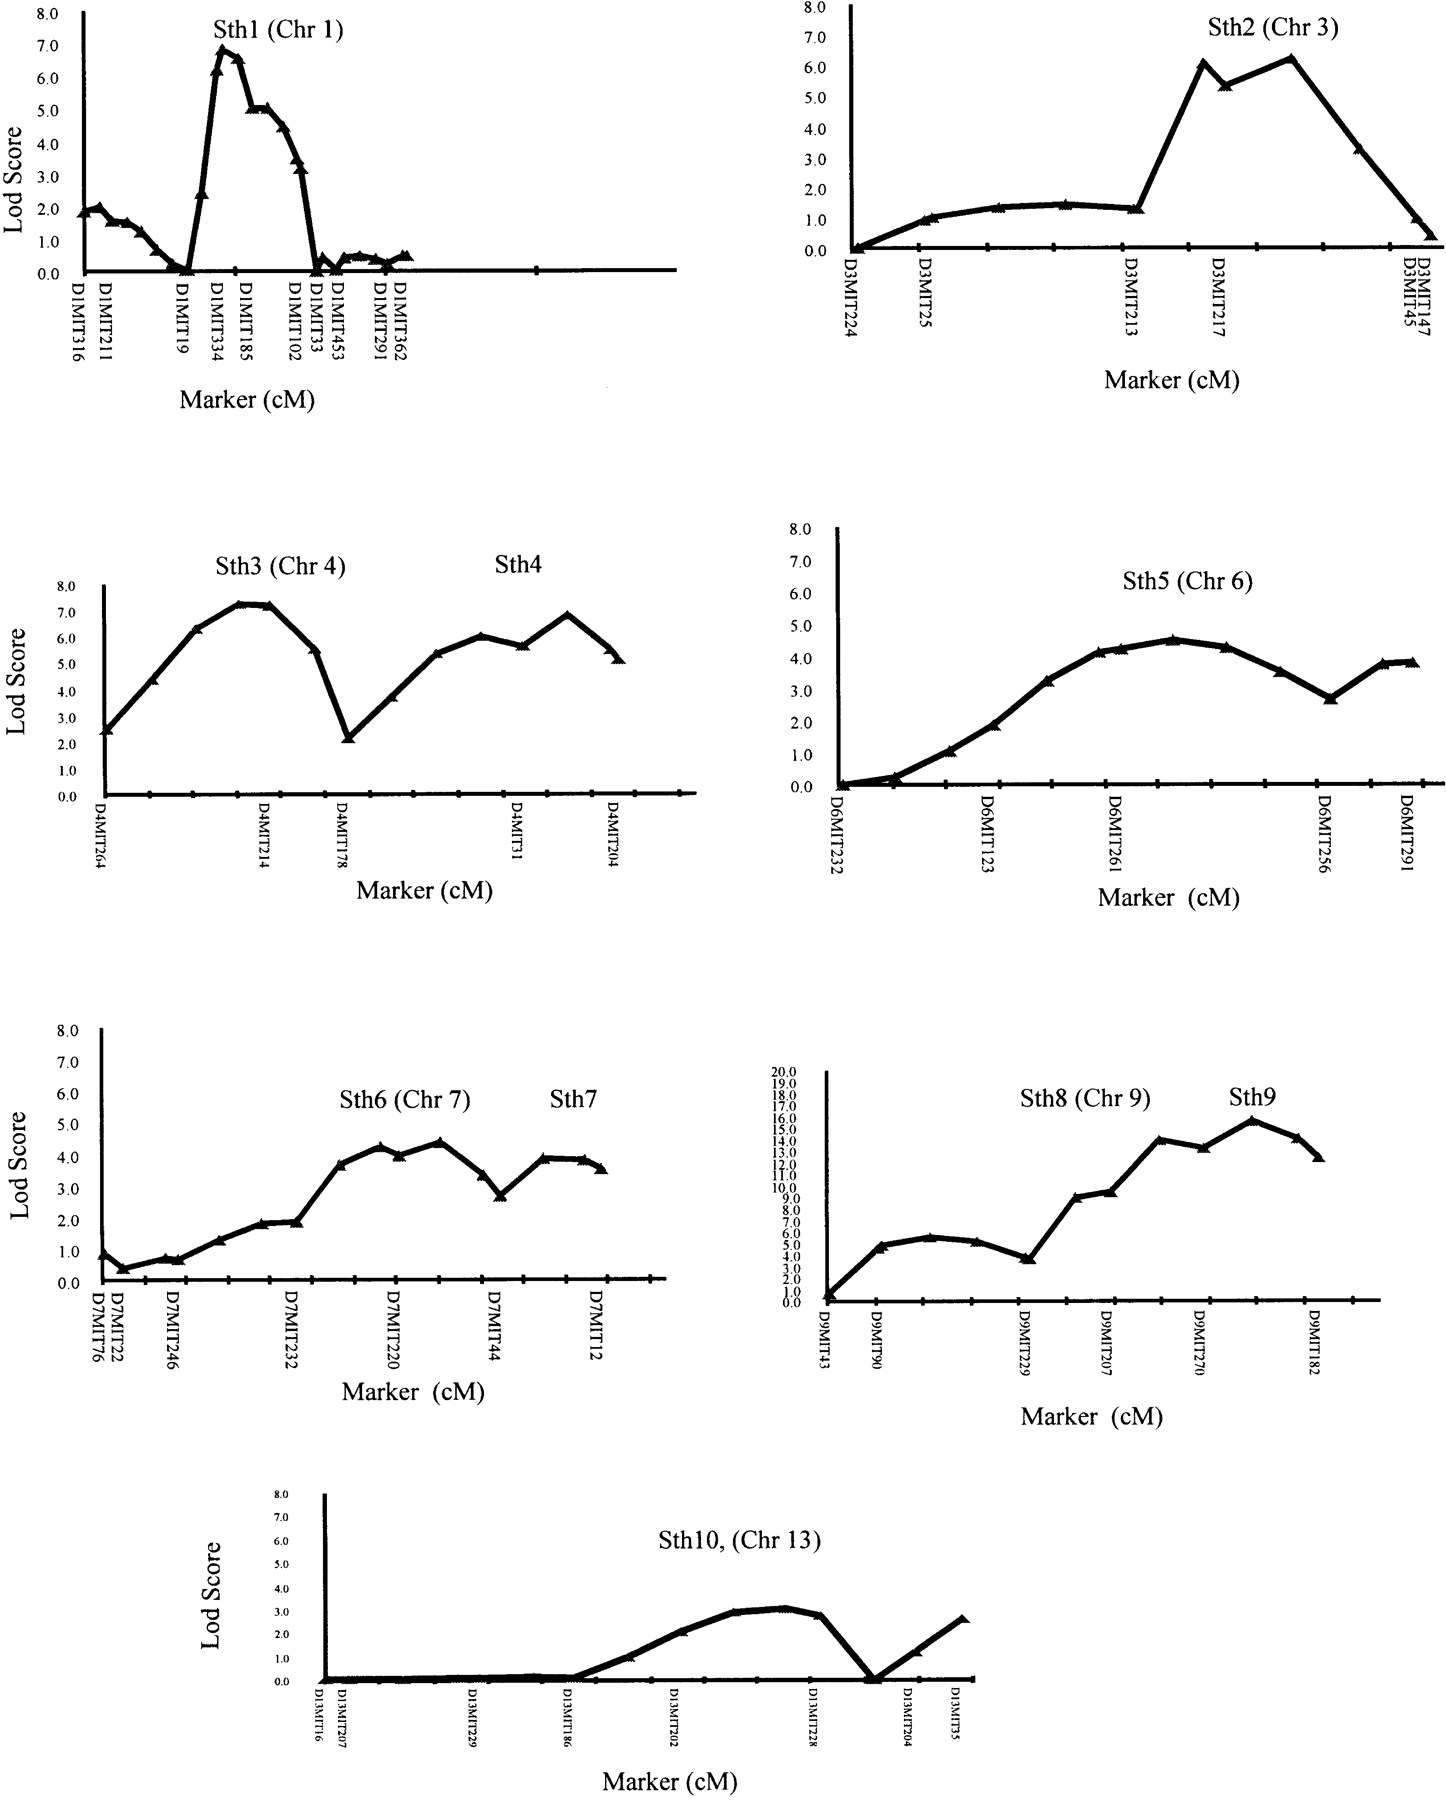
Figure 3.
Interval mapping at day 21, showing significant quantitative trait loci (QTL) (1,3,4,6,7, and 9) and a suggestive QTL on chromosome 13. The logarithm of the odds (LOD) score is on the Y-axis and relative location of marker name and distribution in centiMorgans (cM) on the X-axis. The QTL are labeled as soft tissue heal (Sth) at each peak.


