
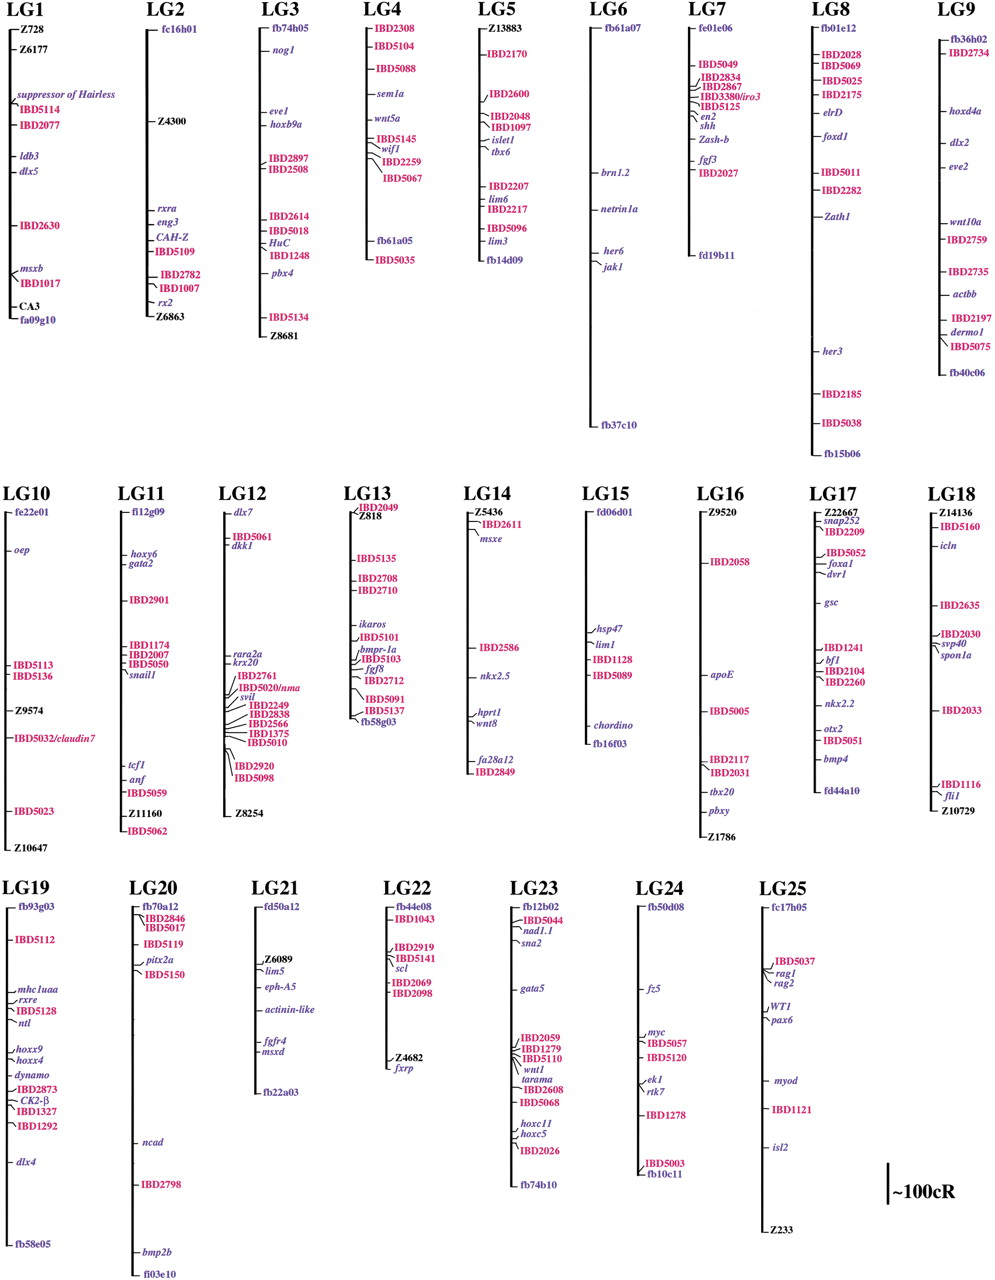
Figure 1.
Map positions of differentially expressed cDNA clones, based on the LN54 mapping panel (Hukriede et al. 1999, 2001). On each linkage group (LG) a selected set of previously mapped genes (in blue) and microsattelite markers (in black) are shown for orientation; clones from the present screen are shown in red.


