
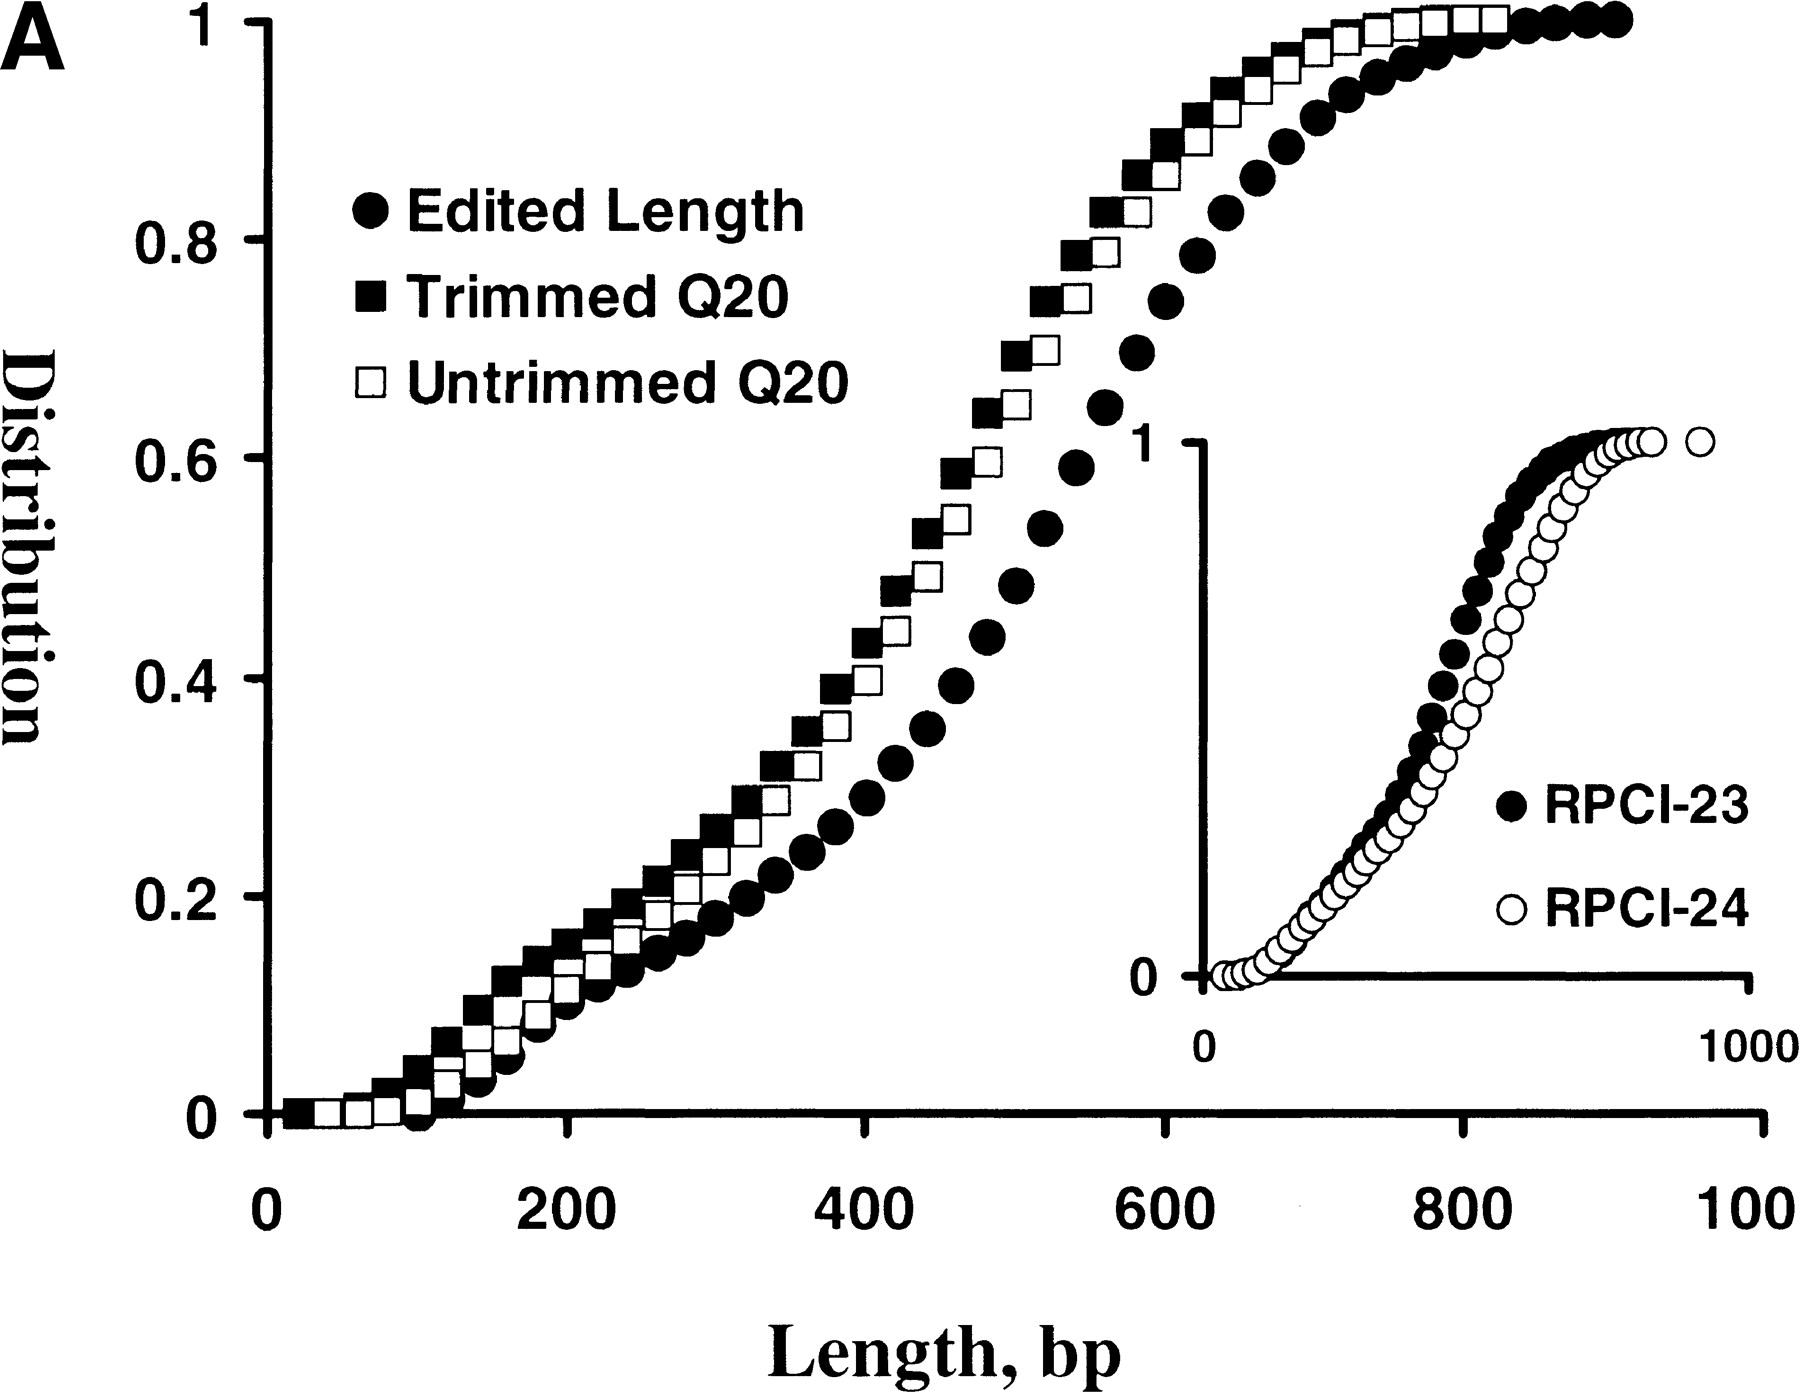
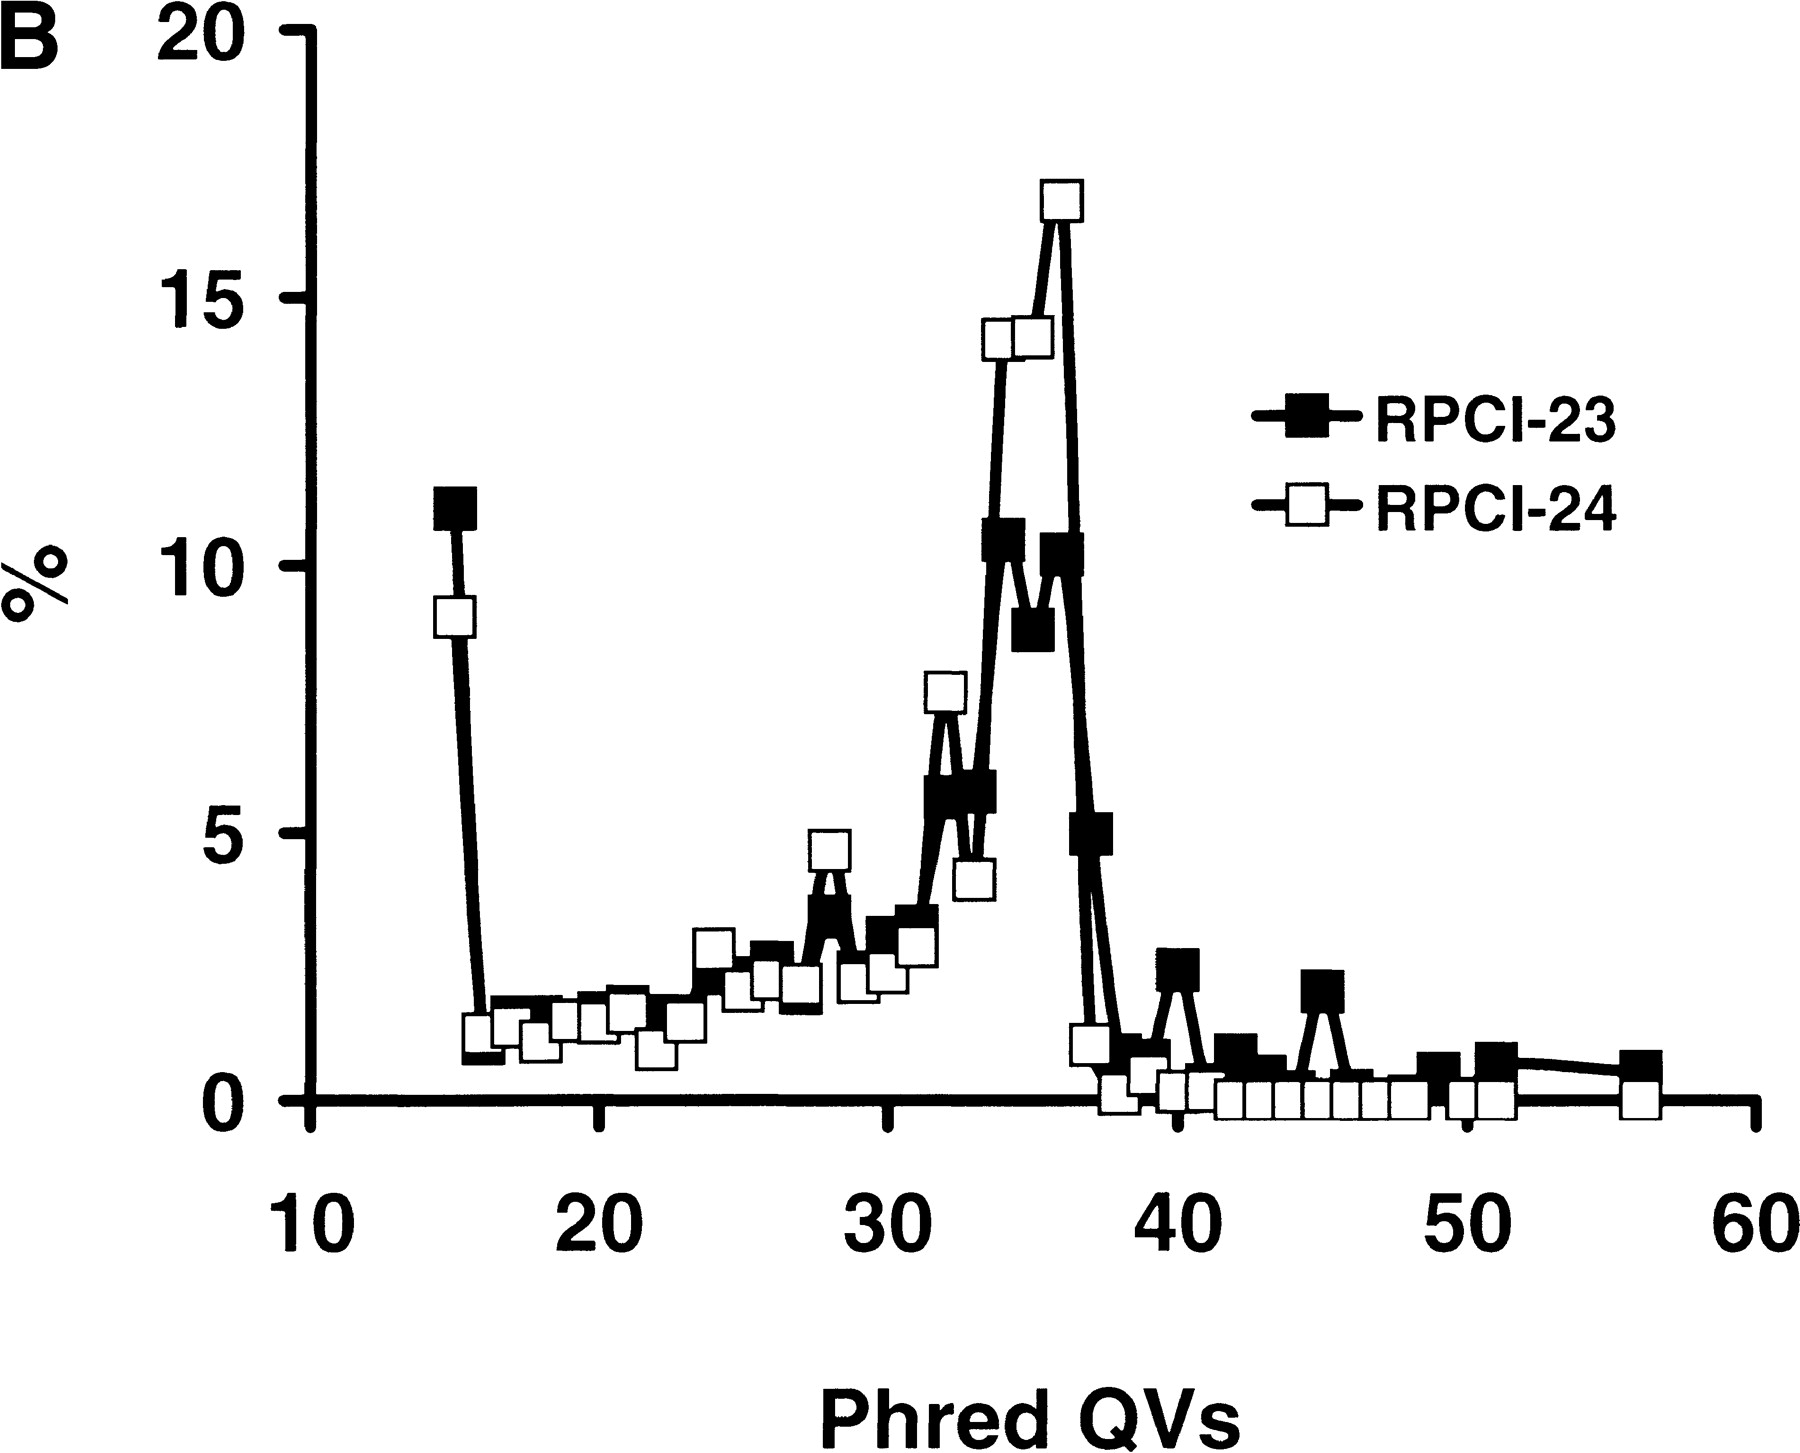
(A) mBES Q20 length and read-length distributions. A total of 453,137 mBES traces (277,490 with 225 Mb from RPCI-23 and 175,647 with 163 Mb from RPCI-24) were processed by a base call programphred and quality scores were further adjusted withTraceTurner from Paracel. The reads were then trimmed for low-quality bases and vector and E. coli sequences by a program lucy with criteria as follows: (1) a < 2.5% overall base-call error rate; (2) a minimum of 100 bp reads; and (3) free of vector and E. coli sequences. The phredQV of each base was examined and bases with QV ≥ 20 (Q20 bases) were counted for each sequence before and after trimming. The distributions of the Q20 length before trimming (□) and after trimming (▪), the edited read length (●) were plotted here. The Q20 length ranged from 10 to 910 bp with an average of 438 bp and a SD of 159 bp before trimming, and ranged from 3 to 839 bp with an average of 406 and a SD of 166 bp after trimming. The trimmed sequence reads ranged from 101 to 984 bp with an average of 485 bp with a SD of 174 bp. (Inset) The Q20 length distributions of the untrimmed sequences, indicating that RPCI-24 (○) had more Q20 bases than RPCI-23 (●). (B)phred QV compositions of RPCI-23 and RPCI-24 mBES databases. After the same set of mBESs were trimmed as described in Fig. 1A, phred QVs of 218,722,217 total bases (128,961,303 for RPCI-23 and 89,760,914 for RPCI-24) were examined, of which 10% had QV < 15 and 84% had QV ≥ 20. RPCI-24 (□) had a slightly higher Q20 base fraction (86%) than RPCI-23 (▪, 83%).


