
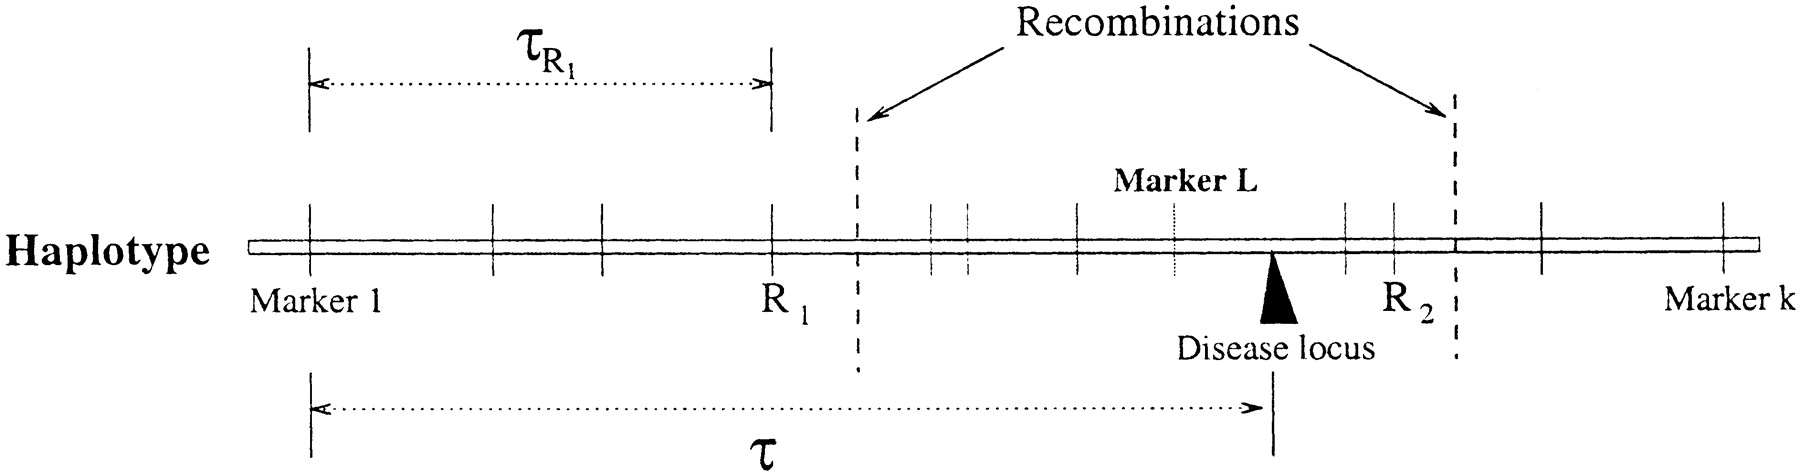
Figure 5.
A graphical representation of the haplotype model. There are a total ofk markers. Parameter τ is the “recombination distance” from the disease locus to the leftmost marker (which is equal to −log{(1+e −2d)/2}, whered is the genetic distance). The recombination event closest to the disease locus from the left arm occurred between markersR 1 and R 1+1 and that from the right arm occurred between markers R 2 andR 2+1.


