
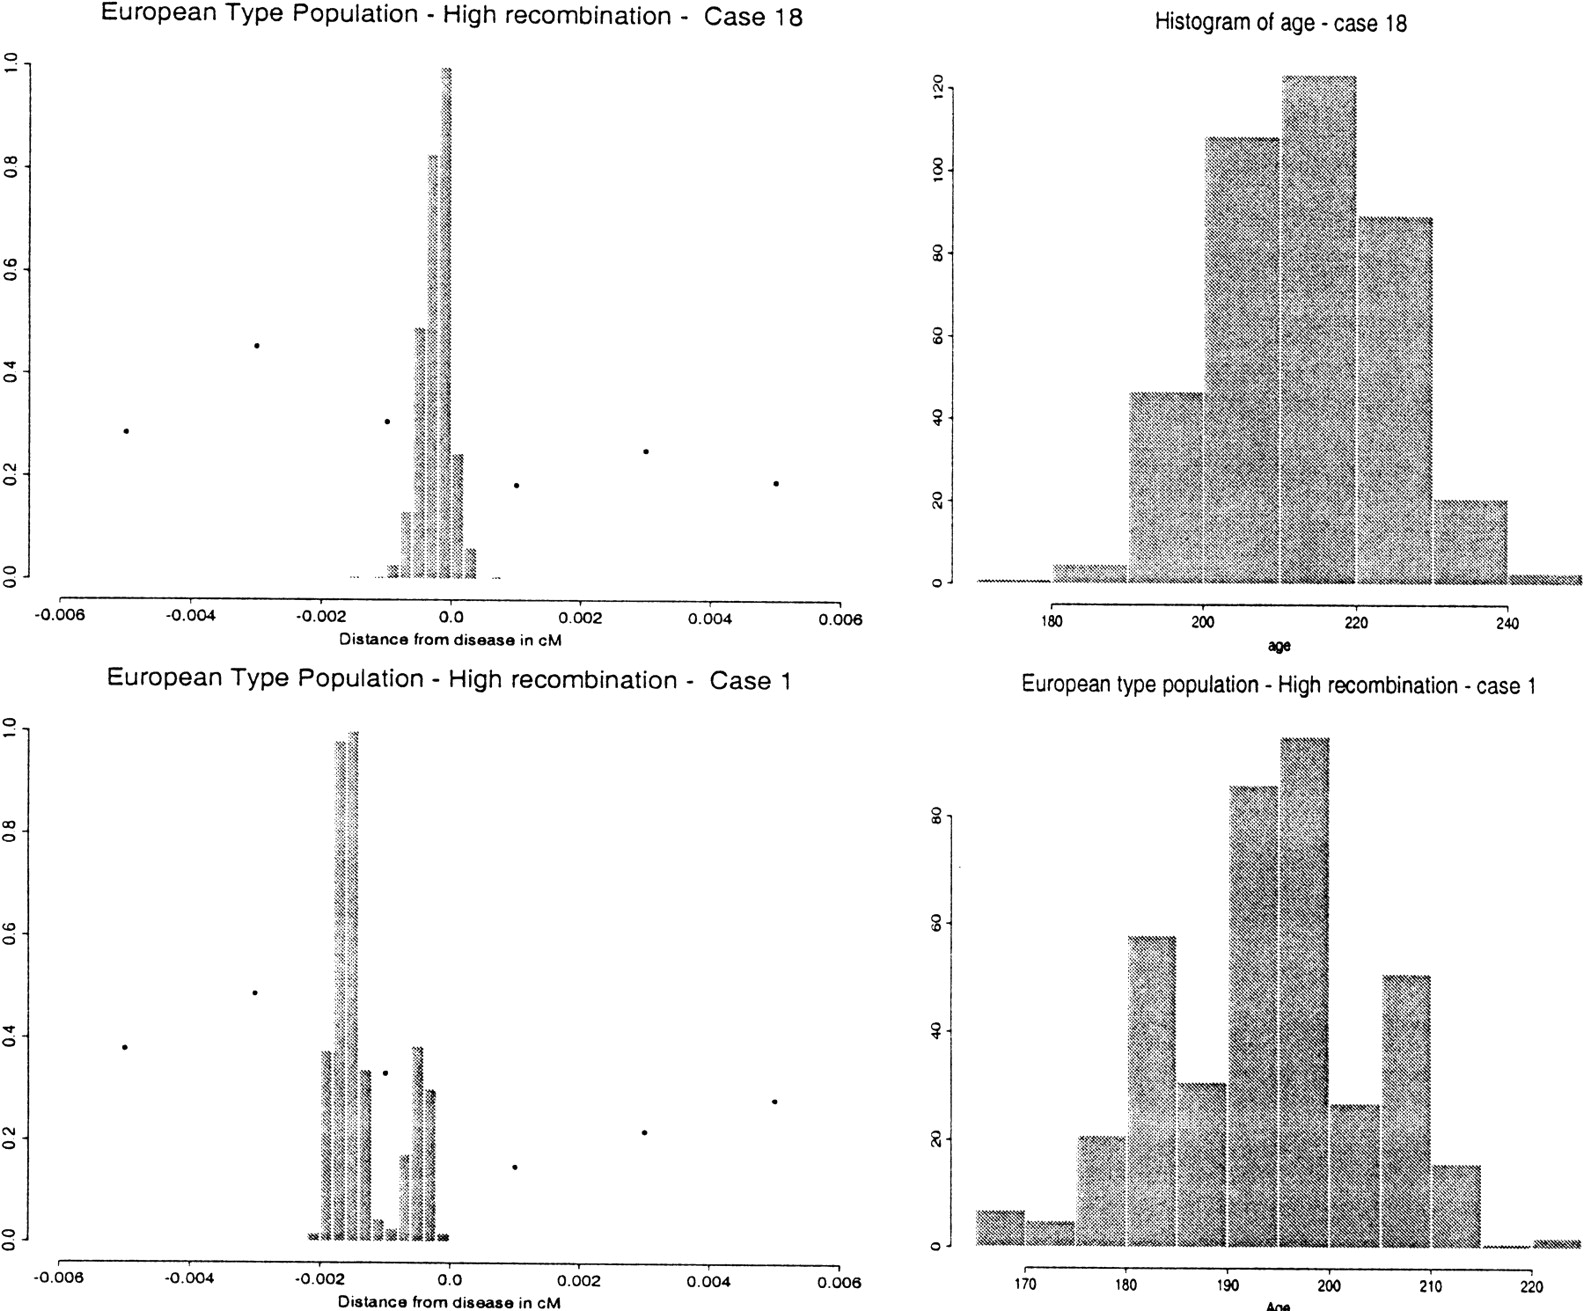
Figure 4.
Examples of outcomes of the first simulation. Left panels: Histograms of samples from the posterior distribution of the disease gene for two cases of our simulation (the true location is at position 0 and the distances are in Morgans). Superimposed are the values of δ corresponding to the markers whose position is within the limits of the picture. Right panels: Histograms of samples from the posterior distribution of the age in the same two cases.


