
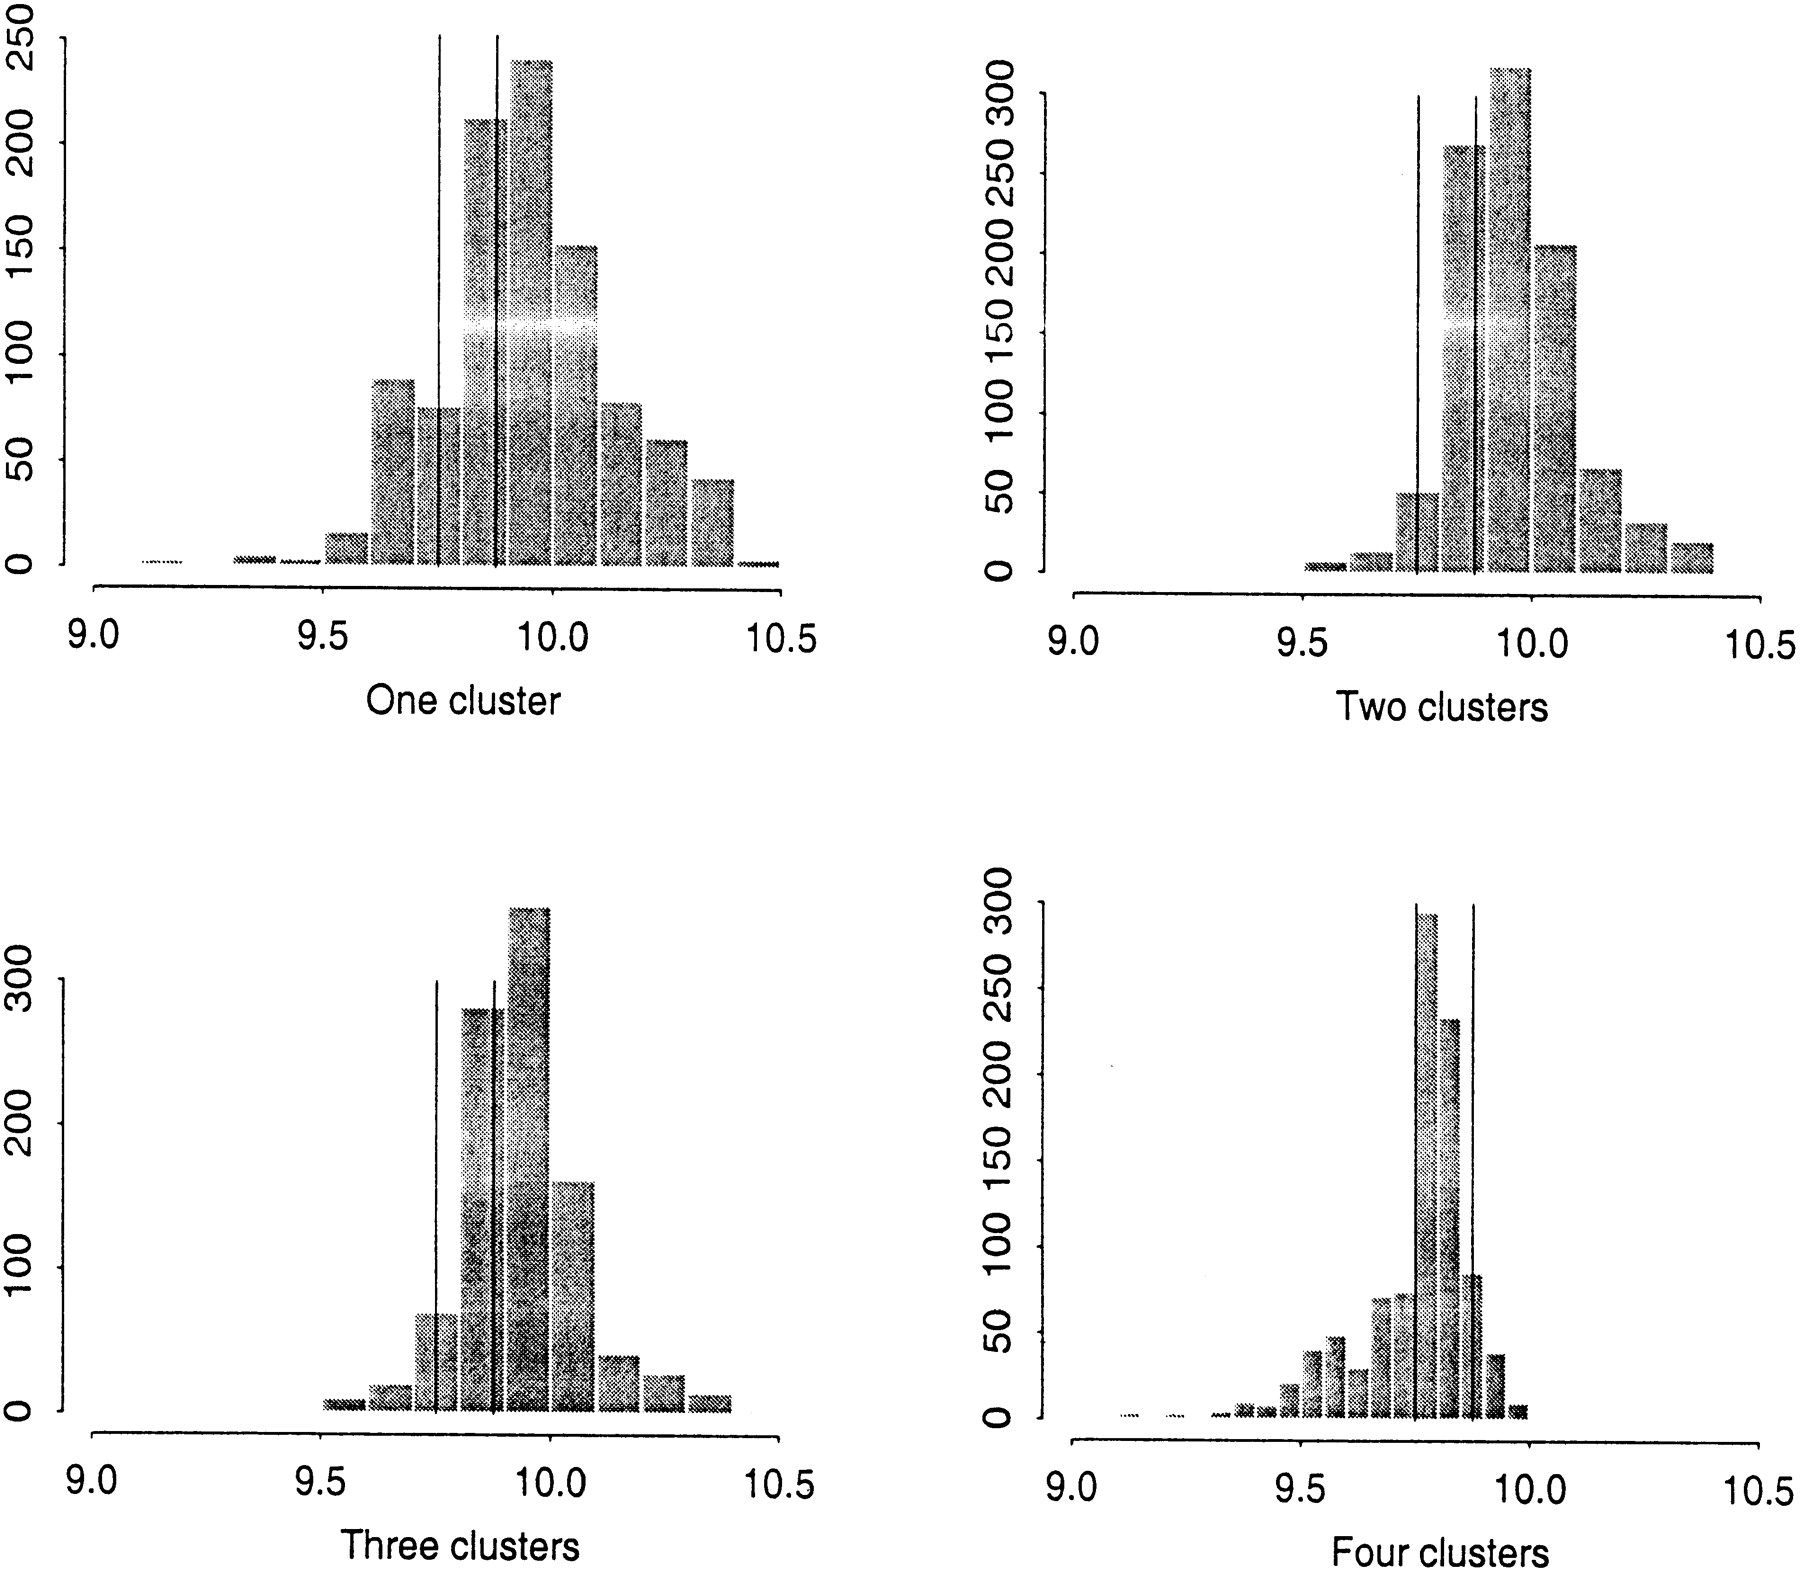
Figure 3.
Histograms of the posterior samples for the location of the Friedreich ataxia gene mutation under the assumption of one to four clusters, respectively. The X-axis is the distance between the first marker and the disease locus (in cM). The vertical lines indicate the two marker positions flanking the disease gene.


